Understanding Turning Point and Trend
In this article, we will help you to understand the turning point and trend in the context of the day trading strategy used in Forex and Stock market. A trend refers to the general direction in which the prices of currency pairs move over a specific period. It can be:
- Long-term Trend: Lasting for months or years.
- Short-term Trend: Spanning days or weeks.
- Upward (Bullish) Trend: Prices rising.
- Downward (Bearish) Trend: Prices falling.
- Sideways (Range-bound): Prices moving within a narrow range.
Successful Forex trading involves identifying trends and positioning oneself for profitable entry and exit points. On the other hands, the turning points are critical moments in price movement. They mark the transition from one trend to another.
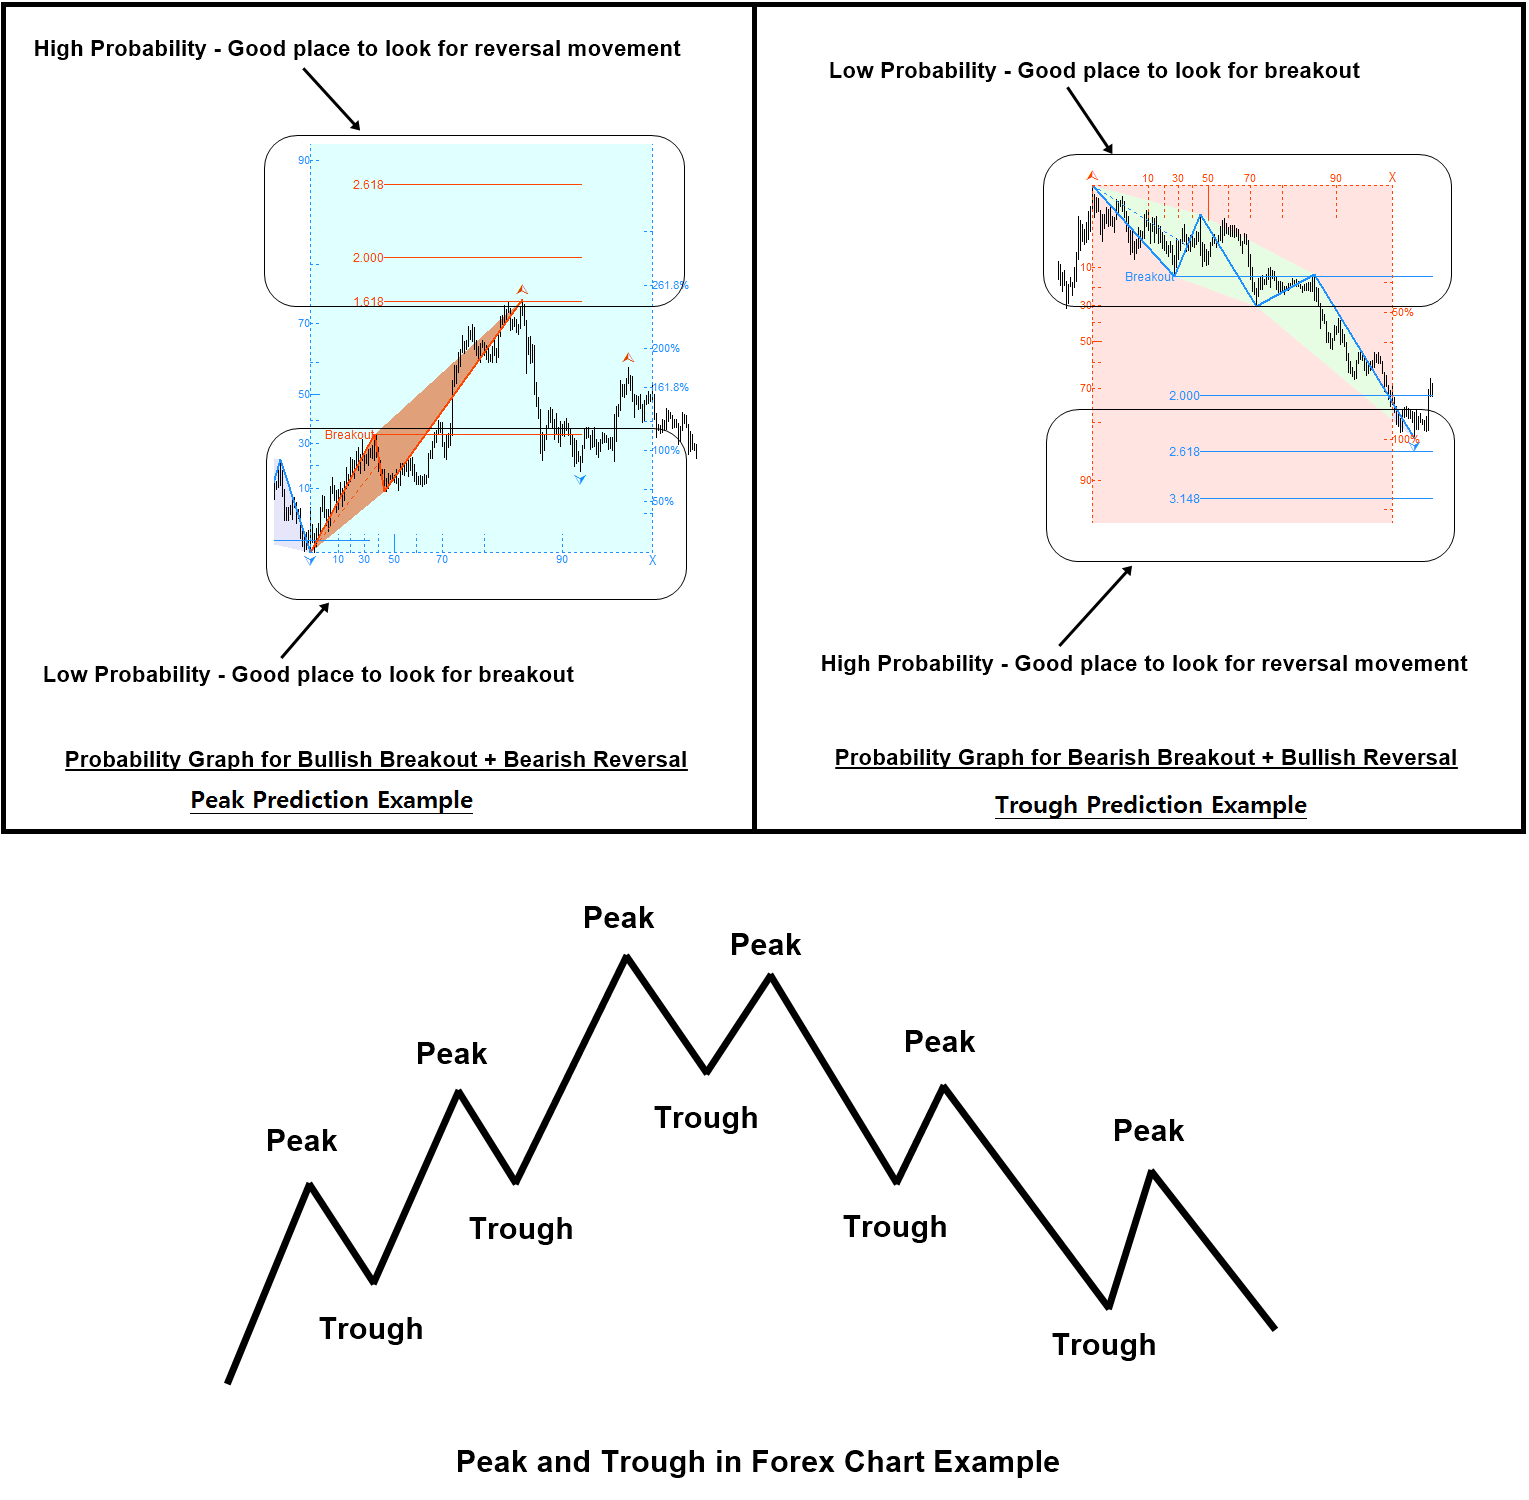
- Uptrend Turning Point: A series of Up Days followed by a Down Day signals the end of an uptrend and the start of a new downtrend.
- Downtrend Turning Point: A series of Down Days followed by an Up Day indicates the end of a downtrend and the beginning of a new uptrend.
Traders use various tools (such as pivot points and Gann Swing Charts) to identify these turning points and anticipate trend changes. Now, let us dig deeper on turning point and trend.
1. Understanding Turning Point and Trend
One way to understand the turning point in the financial market is to study its causes. One such explanation is to look at the price dynamics in Forex and Stock market. After extensive price rise, the price must fall because many people want to sell them to materialize the profit. Likewise, after extensive price fall, the price must rise because many people think they are cheap and they will start to buy them again. This price dynamics will generate the bullish turning point and bearish turning point in the financial market. Beside the price dynamics, we can find other causes of the turning point from the economic point of view. For example, in the Stock market, the intrinsic value of the company is one important cause of the turning point. This connects the turning point with the value investing principle created by Benjamin Graham. Similarly, the rise and fall of the currency price are often followed by the fundamental data release in the Forex market. Fundamental data release is another important cause of the turning point. At the same time, correlation and cointegration suggest the presence of a long-run equilibrium towards which the economic system converges over time. The dynamics can be observed and explained well in the pairs trading strategy. Understanding the causes of the turning point in the economic point of view can help us to use the turning point better in our trading. At the same time, it can help us to find the flow of the smart money. Therefore, we will explain the dynamics in regards to the value investing, Fundamental analysis and pairs trading.
2. Turning Point and Value Investing in the Stock Market
Value investing is an investment strategy to buy stocks that appear to be trading for less than their intrinsic value. The modern value investing is considered to be derived from the investment philosophy first taught by Benjamin Graham (Intelligent Investors, 1949). One of the high-profile follower of value investing includes Warren Buffett, the Berkshire Hathaway chairman. Warren Buffett often describes the value investing as his main investment strategy. In the book: Intelligent Investors, Benjamin Graham brought the concept of the margin of safety. Margin of safety tells that the investor should only purchase stocks when their market price is significantly below their intrinsic value. Although this sounds complicated, the similar philosophy is observable in many area in our life. For example, the safe following distance in driving and the safety factor in engineering are the two analogical examples to the margin of safety. They are basically the thought process to reduce or to eliminate the failure or accident in our life. For example, more distance between you and the car ahead can give you the time to recognize a hazard and to respond safely. Hence, the safe following distance is often recommended for the safe driving. To understand the safety factor, consider an example of a highway bridge. At the entrance of the bridge, there will be one signboard showing the maximum load or weight limit. Does this mean that the vehicle little heavier than the maximum load will cause collapsing of the bridge? In fact, no or very low chance only. Typically, the physical limit of the bridge is designed to be two to three times more than the maximum load displayed in the signboard. Hence, unless the vehicle is heavier than the physical limit of the bridge, it won’t collapse. However, still to be safe or to avoid the accident, the vehicle heavier than maximum load should not pass through the bridge. Likewise, in value investing, it recommends to find the enough gap between the intrinsic value and the market price. Just like higher difference between the maximum load and the limit of the bridge makes safer, the higher gap between intrinsic value and the market price provides the safer investing opportunity. This is the underlying logic behind the margin of safety in value investing.
The margin of safety gives rise to two important trading guideline. First guideline is the preservation of the capital by preventing loss. Second guideline is buying the stock at a lower price while the intrinsic value of a company is sufficiently higher. To fulfil these two guidelines, the value investors need to estimate the intrinsic value of the company and to select the stocks with higher margin of safety. Therefore, value investors often use the financial ratios systemically to find the underestimated stocks. When the stocks are underestimated, their financial ratios are below the average value marginally. In another words, wider spread between their financial ratios and the average value are considered to be better.
• Price to Earnings Ratio (PER) = Stock Price Per Share / Earnings Per Share
• PEG Ratio = Price-to-Earnings Ratio/Earning Per Share Growth (Estimated)
• Price-to-Book Value Ratio = Current Stock Price / Book value per share
• Debt-to-Equity Ratio = Total Liabilities / Total Equity
• Return On Equity = Net Income/ Average Shareholder’s Equity
There are two practical reasons to use the financial ratios. Firstly, the financial ratios help to compare one company to another in an objective way. For example, with the financial ratios collected across the industry, we can compare the companies in the similar industry. Secondly, with the historical financial ratios, we can tell if a company is underestimated or overestimated in time. We can use both knowledge to pick the stock with higher margin of safety.
Let us illustrate how the value investors provide the catalytic process in forming the turning point. When the stock price is sufficiently low, value investors will start to look for the opportunity by analysing the intrinsic value. If the price have gone down far below the intrinsic value and the margin of safety is sufficient, then they will start to buy. This might not move the price immediately. However, when many value investors recognize the same opportunity, this will eventually lift the price creating the bullish turning point. Once the price is moving, it can create the momentum. At this point, it is the momentum investors pushing the price high. The bullish momentum will push the price beyond its intrinsic value. When the price move far above the intrinsic value, many value investors will start to sell them to materialize the profits. This selling pressure will be increased if the price moves higher. Finally, this heavy selling pressure can create the bearish turning point.
The value investing is one of the logical driver of the market. The philosophy in value investing often corrects the irrational price movement as it prevents the price moving too far from the intrinsic value. It is also one of the force behind the mean reversion process of the financial market. This also provides one of the explanation to why price moves in the complex zigzag path and why we get to see many price patterns in the market.
3. Turning Point and Fundamental Data in the Forex Market
The foreign exchange market, also known as the Forex market, is a global marketplace where currencies are traded. Currencies are important because we need them to purchase goods and services locally and across borders. There is no central marketplace for the Forex market. The forex market is the largest financial market in the world. It is even bigger than the entire US stock market. There are various participants with different purpose trading currencies in the Forex market. The participants in the Forex market include banks, international companies, hedge funds, money managers, tourists, and individual investors. Just like the price of a stock, the price of a currency is fluctuating every day. The price of a stock is often affected by the intrinsic value of the company and the national economic conditions. However, the price of a currency is affected more with national economic conditions. Hence, the value of a currency can rise and fall when the following economic data are released.
• Economic indicator (e.g. Gross Domestic Product)
• Employment indicator (e.g. Unemployment rate)
• Inflation indicator (e.g. consumer price index)
• Interest rate
• Decisions and announcements from the central banks
• Changes in political and financial regulations
• And so on
As in the stock market, these economic data play some important role to reduce any irrational movement in a currency price. Let us take a look at the interest rate example on EURUSD, the Euro to Dollar rate. The interest rate is considered as an important variable moving a currency price. To find out any adverse effect of the interest rate to EURUSD, we can graph the interest rate difference between USA and Germany against the EURUSD rate. We can observe the mean reversion effect whenever the gap between the interest rate difference and EURUSD rate is large. Simply speaking, the EURUSD rate tends to go back to the fair value whenever the market value is highly deviated from the fair value.
Interest rate is one of many economic data in the Forex market. Besides, many other economic data, like the consumer price index, unemployment rate, trade of balance and so on, can move a currency price in the similar manner. In our trading, we need to watch out the influential economic data. Then, we can identify the currency with the high margin of safety in regards to this influential economic data. As in the stock market, the release of these economic data can affect the forex market in short and long terms. Sometimes, the released economic data can create the turning point during the day. Sometimes, the released economic data can create the turning point in several weeks. The turning points occur to accomplish the mean reversion whenever the currency is overvalued or undervalue too much to the fair value. Sometimes, the government does not like the currency price to move too high or too low. They can take some actions like the quantitative easing, interest rate change, setting up new regulation and so on. As the result of the government actions, the mean reversion process can take place after the price makes the turning point.
As in the price mechanism illustrated with the value investing, the economic data in the Forex market drive the currency price in the similar manner. The economic data provides the ways to describe the intrinsic value of the currency in the Forex market. The bullish turning point and the bearish turning point will occur whenever the spread between the market value and intrinsic value is too high, in fact, it is the absolute spread. This also provides one of the explanation to why price moves in the complex zigzag path and why we get to see many price patterns in the market.
As a day trader or investor, the concept of the turning point and the trend in Forex and Stock market must be understood. These two are not the independent topic from each other. It is better to view them under one subject. It is even better if you understand the concept of the momentum trading and mean reversion trading as any strategy in Forex and Stock market trading will be either one of them. You need to learn how to use them at your favor for your trading. The book: Science Of Support, Resistance, Fibonacci Analysis, Harmonic Pattern, Elliott Wave and X3 Chart Pattern (In Forex and Stock Market Trading) is exactly the book dedicated for this topic. This book will provide many examples of the turning point and trend. In addition, the book brings the concept of the trend and turning point further. It provides the detailed description on the turning point probability and the trend probability.
In the trend strategy, your entry will be at the strong trend movement during the growth phase. This might be good if our entry is not too late. However, if we are late, then we will encounter the loss from early enterers starting to materialize their profits. In the turning point strategy, we are trying to pick up the new trend as early as possible in their birth stage. Therefore, it gives you the opportunity to become the early enterer. Hence, the profitable range is longer than typical trend strategy. In addition, you can also quit your position much earlier than other trend strategy players can.
The longer profitable range means that we need fewer trades to achieve good profits. At the same time, there are some weaknesses of the turning point strategy too. For example, turning point strategy might signal buy or sell entry too early while the ongoing trend was not finished. Since both trend and turning point strategy have their own strength and weakness, it is possible that you can compromise between turning point strategy and trend strategy too. For example, you do not immediately trade at the turning point signal but you can wait until you observe that some price movement is following the new trend direction. Therefore, this becomes semi-turning point strategy. Many of good traders use semi-turning point strategy since they are the hybrid of turning point strategy and trend strategy. The fact is that skills to predict the turning point is important for the successful trading. Even though you are trading with trend strategy, it is still advantageous to have good skills in predicting turning point. Hence, the methodology of predicting turning point was sought after by many legendary traders in the financial market nearly 100 years. It is one clear piece of winning logic for successful trading helping “You act faster than other trader.”
The book can be found in all the major book distributors in the world. Please choose the best book distributor you like from the link below including amazon.com, Google Play Book, scribd.com, Apple Book and so on.
https://www.amazon.com/dp/B0993WZGZD
After understanding the probability, we can improve your trading with either turning point probability and trend probability. The direct representation of its principle can be found from Fractal Pattern Scanner. You have the full access to the turning point probability and trend probability from Fractal Pattern Scanner to improve your trading strategy. Please have a look at the indicator.
Below is the landing page for Fractal Pattern Scanner in MetaTrader version.
https://www.mql5.com/en/market/product/49170
https://www.mql5.com/en/market/product/49169
https://algotrading-investment.com/portfolio-item/fractal-pattern-scanner/
Related Products


