Trend Probability In Technical Analysis
In this article, we will introduce the trend probability in terms of technical anlaysis as the part of Forex and Stock market trading strategy. In the price chart of the Forex and Stock market, trend probability can be considered as a quantified approach toward technical analysis. The easy way to understand the trend probability in Forex and stock market is to think together with the turning point probability as the price series shows the stochastic cycle behaviour. This means that the trend can end at any time and thus we need to measure when the trend will end in probabilistic manner. Since the turning point comes after the trend movement, it is wise to think about the turning point and probability together instead of just reckoning the trend probability alone.
With this point in mind, we can consider the trend probability providing the opposite concept of the turning point probability. In a simple math, we can derive the trend probability by subtracting the turning point probability from one like “1.0 – the turning point probability”. Or if you prefer the percent, we can derive the trend probability by subtracting the turning point probability (%) from one hundred percent like “100% – turning point probability (%)”. Since the turning point probability is drawn from the peak trough transformation directly, the conversion of the trend probability from the turning point probability should be taken as the rule of thumb guideline for your trading. As in the turning point probability, the margin of safety will tell that higher trend probability is safer to predict the breakout or price continuation.
From the simple math for the trend probability (= 1.0 – the turning point probability), we can tell that high turning point probability is equal to the low trend probability. Likewise, we can tell that low turning point probability is equal to the high trend probability. For the first example, say that the price is moving down from the last peak. If the turning point probability is less than 50%, there is a high chance that price will continue to fall. It can be confirmed because the trend probability is greater than 50% (=100% – 50%). The chance that price will continue to fall is even higher if the turning point probability is less than 30%. It can be confirmed because the trend probability is greater than 70% (=100% – 30%). If we need to predict the breakout or price continuation, then it would be safer to choose the trend probability 70% or over in this example.
For the second example, say that the price is moving up from the last trough. If the turning point probability is less than 50%, there is a high chance that price will continue to rise. It can be confirmed because the trend probability is greater than 50% (=100% – 50%). The chance that price will continue to rise is even higher if the turning point probability is less than 30%. It can be confirmed because the trend probability is greater than 70% (=100% – 30%). If we need to predict the breakout or price continuation, it would be safer to choose the trend probability 70% or over in this example. These examples are purely based on the interpretation of the probability alone. However, the usage of the turning point probability or the trend probability can be extended with other price pattern analysis. At the most basic level, you could use the given Fibonacci retracement level together with the turning point probability. In the next chapter, we will discuss some other ways to combine the turning point probability with other price patterns.
To help you understand better with trend, now let us think about what makes the trend itself. The best way to explain this is to use the notion of Equilibrium process.
Simply speaking, Equilibrium process is the underlying process behind the trend. Equilibrium process is the market force moving the price series in one direction. Equilibrium process is not different from the equilibrium concept found in the classic supply-demand economic theory. Literally, it is the force to move price to release the unbalance between supply and demand. There are many types of Equilibrium process (trend). They might be linear trend like Pattern (2, 1) or they might be nonlinear trend like Pattern (3, 1) and (4, 1). The three trend patterns, that are linear, exponential and damped, are common. Exponential trend (3, 1) represents the strong trend with increasing momentum. Damped trend (4, 1) represents the trend with reducing momentum. These six trend patterns are found most frequently in the financial market comparing to other trend patterns.
Equilibrium process is highly related to market fundamentals. Equilibrium process is the direct representation of the supply demand balance in the financial market. Assuming there is the fixed number of shares for Google, if more people want to buy a stock than sell it, then the share price for Google will move up. We call this as a bullish trend. Likewise, if more people want to sell a stock than buy it, there would be greater supply than demand and the price would fall. We call this as a bearish trend. When there is the imbalance in supply and demand force, then the price will try to move towards equilibrium to release the imbalance. The supply demand imbalance is often caused by the fundamental change in the market. For example, change in the taxation or interest rate can change the quantity of supply and demand force dramatically. Natural disasters like Earthquake or Hurricanes or other serious transmissible diseases can influence the dynamics of supply demand too in the financial markets. War, terror, or other political corruption can reduce the demand of the financial assets affected by them.
If the Equilibrium process (trend) is overwhelmingly dominating in the price series, prediction is easier. However, the strength of Equilibrium process differs for different financial price series. It is also not easy to quantify or to isolate the portion of Equilibrium process from rest of regularities perfectly. In reality, Equilibrium process can be caused by multiple information sources introduced in different time. Each information source will be diffusing across the market in time. Some of them are slowly and some of them are quickly. Some information source will introduce bullish Equilibrium process, which increase demand and reduce supply. Some other information source will introduce bearish Equilibrium process, which reduce demand and increase supply. Since each trader and investor will react differently to different information sources, the diffusion process of each information source can vary dramatically. Modelling or visualization of diffusion process of multiple information sources is complex. If there are many bullish and bearish Equilibrium process acts together in the price series, the simplest way of guessing the market direction is calculating the net of bullish and bearish equilibrium process in the market. However, with simple netting, you will still miss the time factor because each information source will be diffused in different speed. Another difficulty comes from quantifying bullish and bearish strength of each source. Typically, to quantify them correctly, we need good amount of historical data. Especially if you need the accuracy for trading quality, you will need much more data than just doing some academic research. To most of average trader, this is not accessible.
Therefore, trader uses technical indicator because technical indicator is simple alternative to the complex diffusion process modelling. Moving average type of technical indicators can work well for this type of market because they eliminate randomness and leave the trend pattern in the price series. Simple moving average, exponential moving average and zero lag moving average can be the great help for this type of market. Normally the strong Equilibrium process can be captured with typical momentum trading strategy. For example, all moving average cross over strategy will work well. In this type of market, following trend is wiser than using the counter trend trading strategy. The real question is “Can we have such a simple market we can trade with moving average alone”? If so, we will be very lucky. Most of time, the financial market will show more complex behaviour, which will be introduced in later chapters. However, in some stock market, you might be able to find few easy opportunities. In Forex market, I think there is not so much opportunity to win with moving average indicator alone.
When the turning point probability is high, we can expect the turning point to arrive within the fractal cycle. Like the margin of safety described by Benjamin Graham, it is safe to use the turning point probability in conservative manner. We should only look for the turning point within the higher probability area. The margin of safety will tell that higher turning point probability is safer to predict the turning point. On the other hand, we can look for the breakout opportunity or we can expect the price to move in the same direction within the lower turning point probability area. We can consider the trend probability providing the opposite concept of the turning point probability. In a simple math, we can derive the trend probability by subtracting the turning point probability from one like “1.0 – the turning point probability”. Or if you prefer the percent, we can derive the trend probability by subtracting the turning point probability (%) from one hundred percent like “100% – turning point probability (%)”. Since the turning point probability is drawn from the peak trough transformation directly, the conversion of the trend probability from the turning point probability should be taken as the rule of thumb guideline for your trading. As in the turning point probability, the margin of safety will tell that higher trend probability is safer to predict the breakout or price continuation. This information was taken from the book: Science Of Support, Resistance, Fibonacci Analysis, Harmonic Pattern, Elliott Wave and X3 Chart Pattern (In Forex and Stock Market Trading). This book will provide the scientific rational for chart patterns, connection with economics, chart pattern detection examples, how to use them and how to improve them in Forex and Stock market.
The book can be found in all the major book distributors in the world. Please choose the best book distributor you like from the link below including amazon.com, Google Play Book, scribd.com, Apple Book and so on.
https://www.amazon.com/dp/B0993WZGZD
https://play.google.com/store/books/details?id=MME3EAAAQBAJ
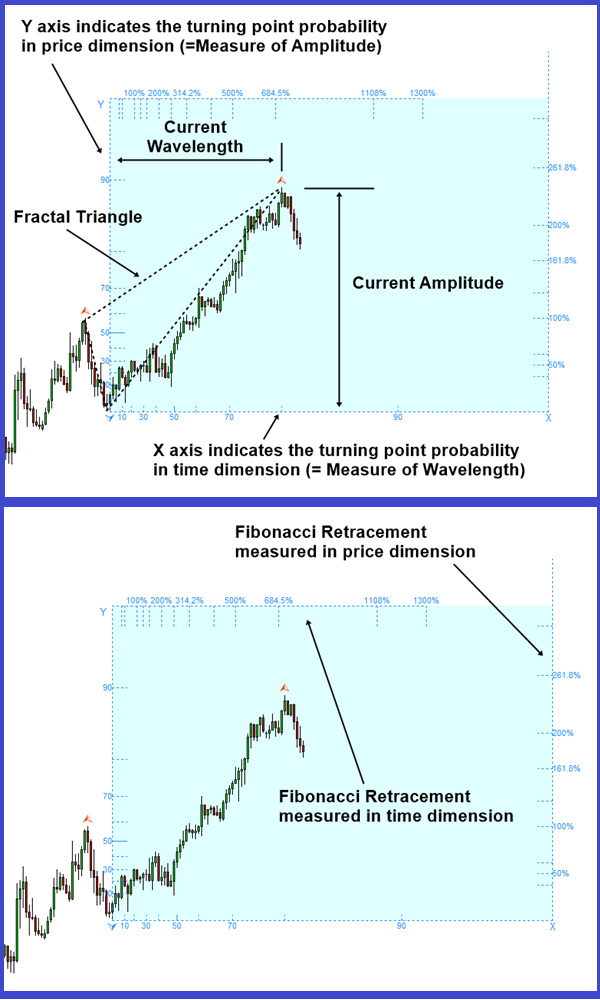
To present the turning point probability in Forex and Stock Market, we have devised the simple turning point probability graph. When we predict the peak, in the probability graph, Y axis (=the left axis) indicates the turning point probability in price dimension and X axis (= the bottom axis) indicates the turning point probability in time dimension. The probability ranges from 0.0 (=0%) to 1.0 (=100%). Typically, there is no practical application making use of 100% probability in the world. Since our calculation is based on the price data only (i.e. empirical probability), we recommend using 90% probability or less for the maximum probability. For example, even if the price stays above the 90% probability, it is better to treat them as 90% or less depending on how conservative your trading style is.
You have the full access to the turning point probability and trend probability from Fractal Pattern Scanner to improve your Forex and Stock Market Trading. As it was suggested from the book, the display probability in the Fibonacci Probability Graph is the turning point probability. You will use the turning point probability to gauge the trend probability as it was guided from the book. Please have a look at the indicator. Of course, you have this tool built in our Optimum Chart too.
Below is the landing page for Fractal Pattern Scanner in MetaTrader version.
https://www.mql5.com/en/market/product/49170
https://www.mql5.com/en/market/product/49169
https://algotrading-investment.com/portfolio-item/fractal-pattern-scanner/
Related Products


