Support and Resistance Trading
In the trading community, support and resistance was not viewed as the scientific tool until it was pin down as the price pattern derived from the fractal wave. After we have connected the concept of support and resistance to Fractal wave, we have learnt what they are, how to use and how to improve them. Now, it is the scientific tool as it was introduced in the book: Science Of Support, Resistance, Fibonacci Analysis, Harmonic Pattern, Elliott Wave and X3 Chart Pattern (In Forex and Stock Market Trading). If it is used by the right hand, it is the tool that can bring you a lot of benefit for your trading beyond any technical indicators.
Support is the price level at which buying is stronger than selling. Hence, the declining of the price below the support levels is often refused. Typically, support level is located below the current market price. Likewise, resistance is the price level at which selling is stronger than buying. Hence, the rising of the price above the resistance level is often refused. Typically, the resistance level is located above the current market price. In fact, several support and resistance techniques are the geometric pattern recognition derived from the fractal wave analysis.
Diagonal support and resistance shares the identical concept to the horizontal support and resistance. Diagonal support and resistance line are also called as the trend line. Diagonal support and resistance are also the price pattern derived from fractal wave analysis. When the connected peaks and troughs provide the diagonal slope rather than the horizontal line, the slope can be considered as the diagonal support and resistance. However, there can be more variations comparing to the horizontal case.
The book: Science Of Support, Resistance, Fibonacci Analysis, Harmonic Pattern, Elliott Wave and X3 Chart Pattern (In Forex and Stock Market Trading) is an dedicated book for the support and resistance. This book will provide the scientific rational for support and resistance, connection with economics, chart examples, how to use them and how to improve them in Forex and Stock market. Even if you are new or existing traders, we recommend this book because the book shares many fresh new ideas towards your day trading. The book can be found in all the major book distributors in the world. Please choose the best book distributor you like from the link below including amazon.com, Google Play Book, scribd.com, Apple Book and so on.
https://www.amazon.com/dp/B0993WZGZD
https://play.google.com/store/books/details?id=MME3EAAAQBAJ
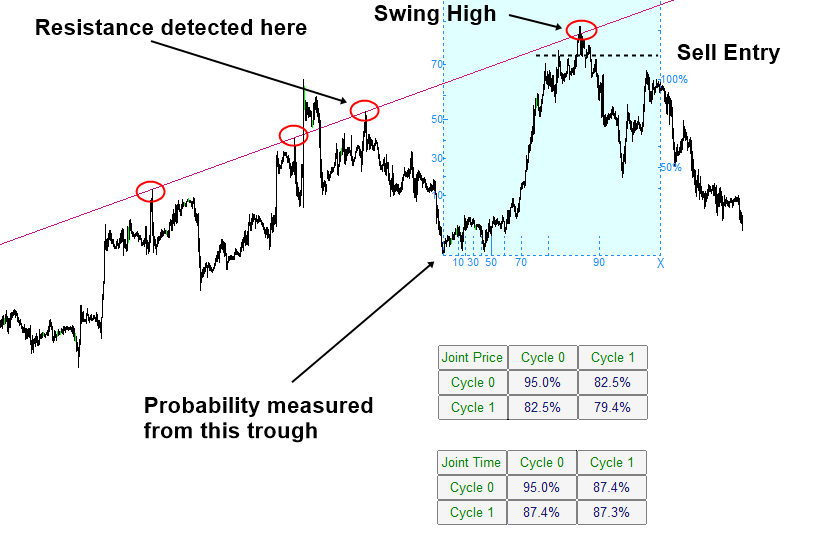
Use support and resistance together with Fibonacci-Probability graph. Fibonacci-Probability graph will provide you the turning point probability, trend probability and Fibonacci ratio analysis in price and time to bring the strategy to another level of trading. How to improve the support and resistance with turning point probability (=1.0 – trend probability) is explained in the book. Fibonacci-Probability graph is exclusively available from Fractal Pattern Scanner in MetaTrader 4 and MetaTrader 5. It could be used to identify the turning point and breakout opportunity. Below is the landing page for Fractal Pattern Scanner in MetaTrader version.
https://www.mql5.com/en/market/product/49170
https://www.mql5.com/en/market/product/49169
https://algotrading-investment.com/portfolio-item/fractal-pattern-scanner/
Related Products


