Market Timing of Turning Point and Trend
When you trade in the financial market, the first thing you need to understand is the turning point and trend. If you read many trading articles and books, you will find the diverse opinion over turning point and trend. Many people view turning point and trend as two separate subjects. However, it might be better to understand turning point and trend as one subject.
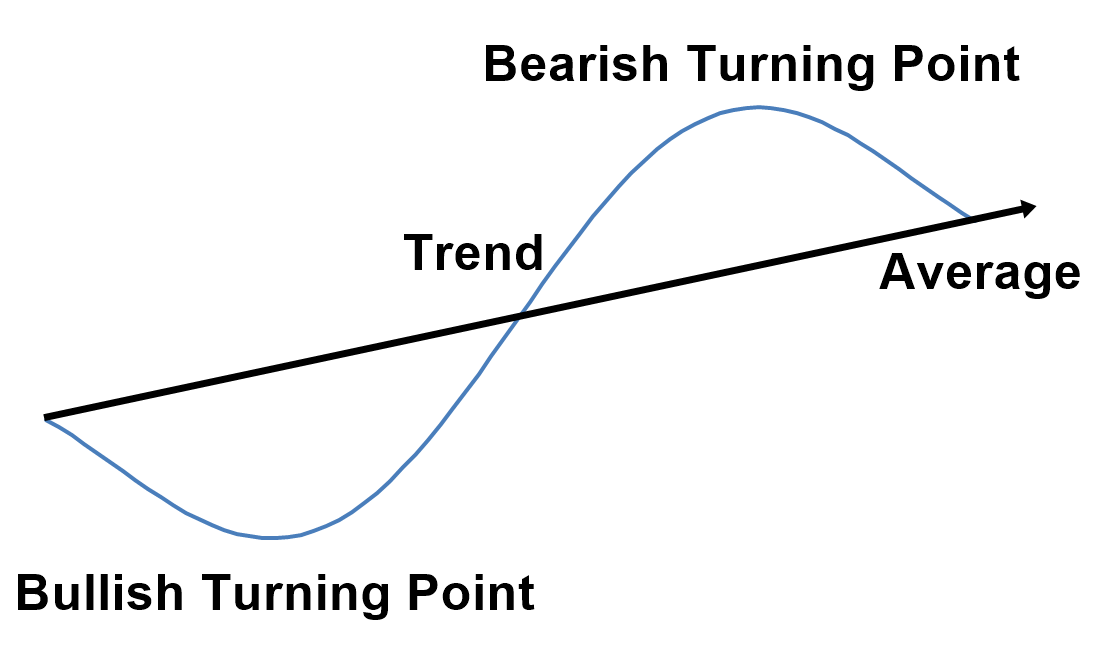
Figure 1-2: Conceptual drawing of trend and turning Point
Let us try to understand the trend. To do so, let us take human as an analogical example. We are born, we grow up, we become mature, and then we die. During this process, we can observe that there are four main stages. These four stages are universal across many creatures and objects observable in the earth.
Birth – Growth – Maturity – Death
Trend also goes through these four stages. Let us take an example in the financial market. For example, if we hear that Apple Inc. has some temporary problem in their smartphone supply line, this could stir up the stock price of Samsung Electronics because the demand for Samsung’s smart phone will be increased. Once this news is spread on the financial market, the upward trend will be born for Samsung’s stock price. At the beginning, this news could be known by few people. Later, more and more people could hear this news. Hence, Samsung’s stock price can build up upward momentum. However, this momentum will not last forever. Once people start to recognize that price rallied too high and some people start taking the profit by selling the stocks, the upward momentum can slow down. Especially, if we hear that Apple recovered the temporary problem in their smartphone supply line, the trend could die completely. As shown in this example, Birth, Growth, Maturity, and Death are the life cycle of trend.
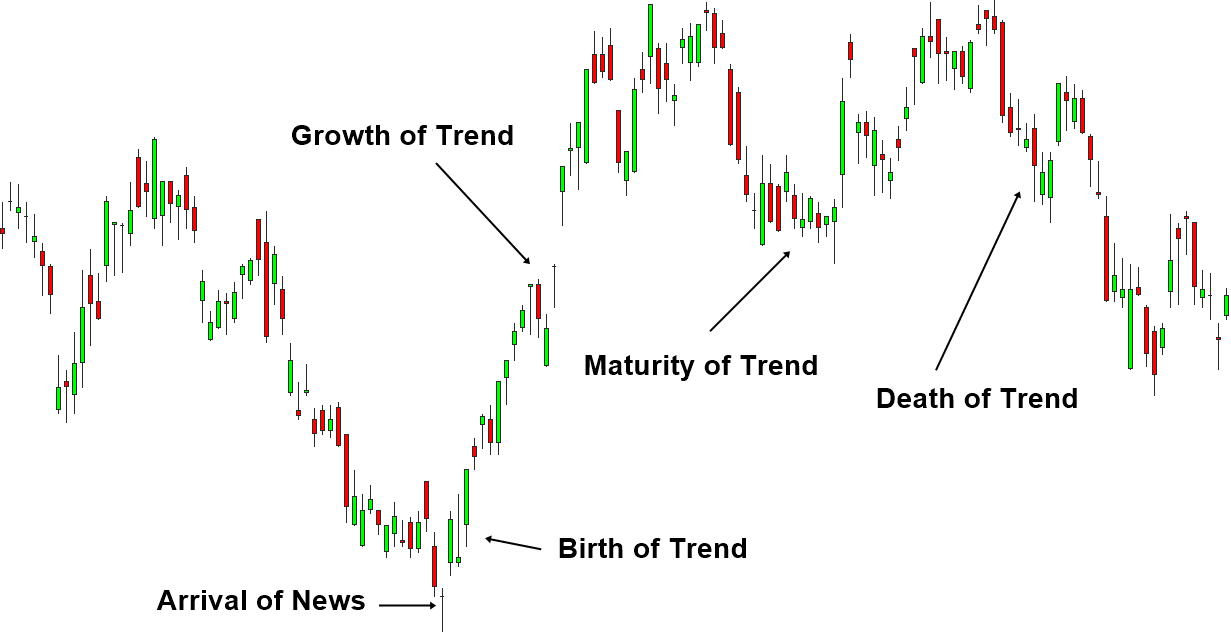
Figure 1-3: Process of birth of new trend in stock market (Chart: www.algotrading-investment.com)
Now let us revisit the definition of turning point and trend. Turning point is the beginning of new trend after the death of an old trend. Hence, turning point strategy refers to the strategy that tries to pick up this new trend as early as possible. This sometimes involves picking up the turning point at the birth stage of the trend. In financial trading, trend strategy typically refers to the strategy that tries to pick up the trend during the growth stage. Hence, most of trend strategy we know is in fact momentum strategy. When the growth of trend is strong, many technical indicators are designed to react on this strong growth.
Therefore, most of trend strategy provides you entry at the growth stage not at the birth stage. For example, if you trade on the buy signal when 20 moving average line crosses over the 50 moving average line, you do need strong upwards movement to lift the 20 moving average line over the 50 moving average line.
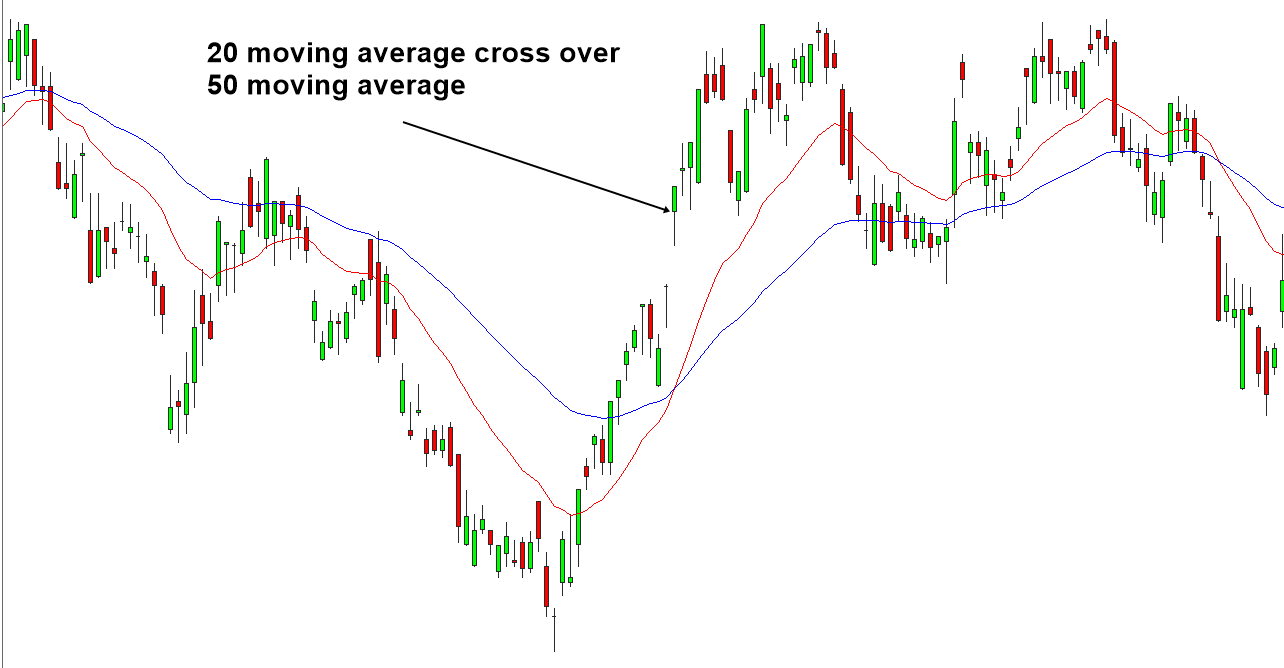
Figure 1-4: Buy entry confirmed by moving average cross over strategy
In contrast to this, in the turning point strategy using the Fibonacci ratio analysis, Harmonic patterns, Elliott wave patterns and X3 patterns, we are looking for the newly born trend instead of the trend in growth stage. Hence, the main difference in turning point and trend strategy is when to enter during the life cycle of trend. Typically, we are seeking to enter near the birth of trend in the turning point strategy. In the trend strategy, we are seeking to enter at the growth stage of trend. You can probably see the difference between these two strategies.
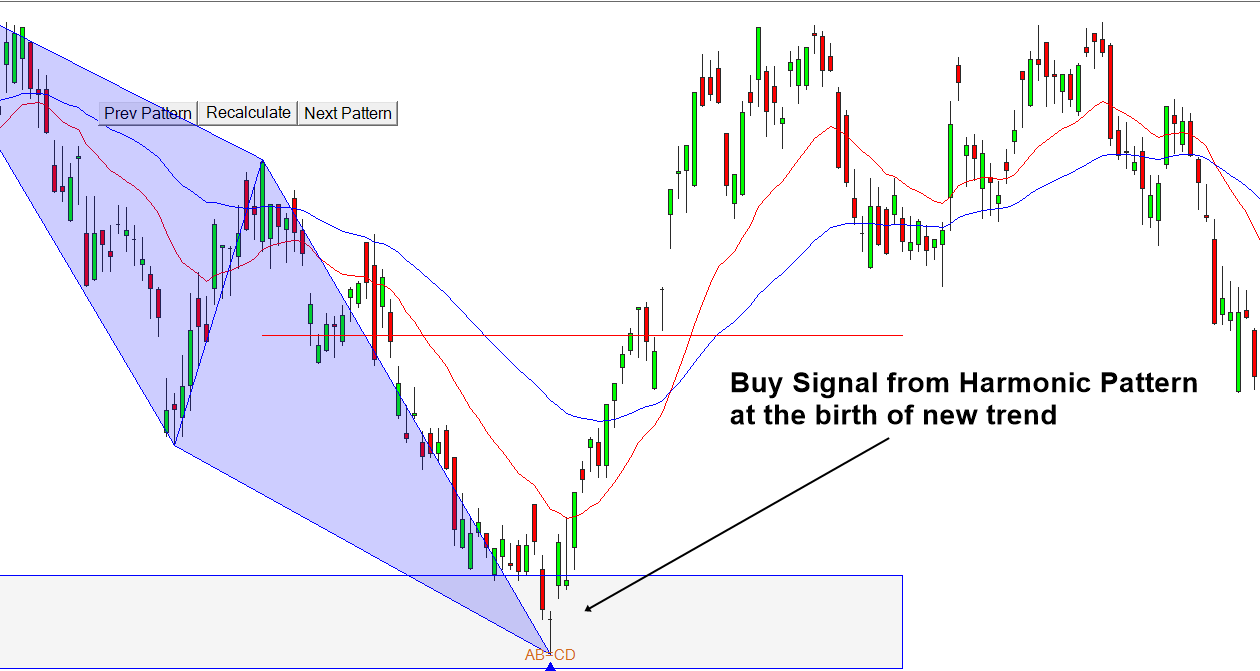
Figure 1-5: Buy entry confirmed by harmonic pattern (Chart: www.algotrading-investment.com, Optimum Chart)
In our example, we considered only one trend. In practice, situation is tougher because we will have many financial and political news released in 24/7 days. Hence, we have to deal with the collection of trends instead of one trend. Some trends will be cancelled off each other and some trends will be adding up to form bigger trend. As a result, sometimes, this collective trend can have a clear direction. However, sometimes, we may not see clear direction from this collective trend but just ranging movement. At the same time, we could have many short-lived trends confusing our entries. Therefore, our trading strategy is subjective to probability of success rate regardless of that you are using turning point strategy or trend strategy.
About this Article
This article is the part taken from the draft version of the Book: Science Of Support, Resistance, Fibonacci Analysis, Harmonic Pattern, Elliott Wave and X3 Chart Pattern. Full version of the book can be found from the link below:
You can also use X3 Chart Pattern Scanner in MetaTrader to accomplish your technical analysis. Here is the product page for the X3 Chart Pattern Scanner. Enjoy the powerful non repainting and non lagging Harmonic Pattern, X3 Pattern and Elliott Wave Pattern indicator.
https://www.mql5.com/en/market/product/41993
https://www.mql5.com/en/market/product/41992
https://algotrading-investment.com/portfolio-item/profitable-pattern-scanner/
Below is the landing page for Optimum Chart, which is the standalone tool to scan the trading opportunities for all symbols and all timeframe in one button click.
https://algotrading-investment.com/2019/07/23/optimum-chart/
Related Products


