Turning Point in Pairs Trading
Pairs trading is a market-neutral strategy that involves buying one asset and shorting another. Pairs trading or the similar trading principle is often employed by the hedge funds and institutional investors. Like value investing and the economic data, the pairs trading explains the occurrence of the turning point well. Therefore, if you have the working knowledge of the pairs trading, it could help you to use price pattern better. At the same time, with pairs trading, we can still apply the margin of safety and spread we have learnt from the value investing strategy. Hence, it is the good trading strategy to be covered in this book.
Pairs trading starts with identifying a pair of assets that are believed to have some long-run equilibrium relationship. When the spread has diverged sufficiently, the strategy will buy the undervalued asset and sell the overvalued asset. The strategy achieves a hedging or risk neutral state by taking two assets at the same time in different direction. Pairs trading strategy is applicable to both Forex and Stock market. The process of the pairs trading can be summarized into the following four steps.
- Identify two assets whose prices have moved together historically in long term.
- Calculate the correlation, co-integration, historical spread between two assets.
- When the spread between two assets are diverged excessively high, then buy the undervalued asset and sell the overvalued asset.
- When the spread is reverting back to normal range, close the positions of the two assets to take the profit.
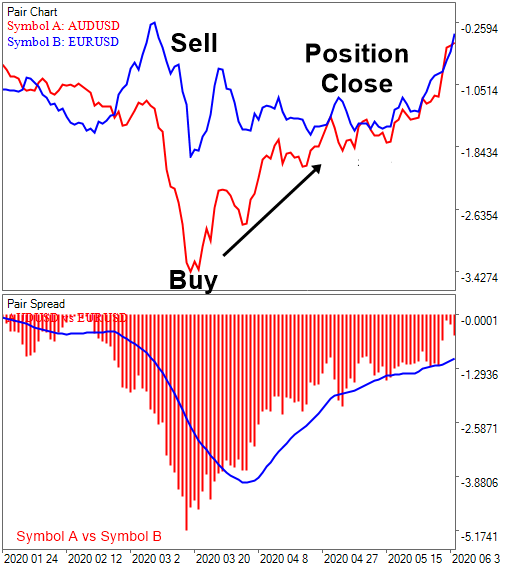
Figure 2-3: Normalized AUDUSD vs EURUSD on the top and spread chart on the bottom (Chart: www.algotrading-investment.com, Optimum Chart)
Except the spread is measured between two assets, the trading principle of the pairs trading is similar to the value investing. For example, the pairs trading involves to recognize the unusual high spread between the two highly correlated assets whereas the value investing involves to recognize the unusual high spread between the intrinsic value and the stock price. Hence, the unusual high spread provides the margin of safety in the pairs trading. In another words, if the spread is higher, then it favours our positions more but with less risk. Typically, the trader applies the statistical knowledge in picking the spread limit to trigger the entry. For example, as in the standard deviation, the spread 3 might be the bottom line to consider the entry. However, the choice of the spread limit to trigger trading could be varying for different assets. Sometimes the historical spread of some assets shows that the spread 4 is the appropriate choice for the spread limit. Sometimes, the historical spread of some assets shows that the spread 3 is the appropriate choice for the spread limit. To choose the right spread limit, it is best to inspect the historical spread first in the chart. However, to provide you some rule of thumb guideline, for the stock market, spread 4 or over might be considered to trigger the entry. For the Forex market, the spread 3.5 or over might be considered to trigger the entry. As the pairs trading shares common ground with statistics, some people call the pairs trading as the statistical arbitrage. As in the margin of safety in the value investing, the higher spread between two assets, the absolute spread in fact, can be considered as the higher margin of safety.
Since the pairs trading involves to take the positions for two assets, this provides some of its own properties, which is different from other strategy. For example, we could provide two illustrative examples when the positions are closed with profits. These two illustrative examples are not necessarily the exhaust list of scenarios for the movements of two assets. However, we have selected them as they can visualize the process of the formation of the turning point better than other scenarios.
For the first example, consider that we bought the one asset with low price and sold another asset with high price when the spread was diverged sufficiently high. In this example, the asset with low price (=Symbol B) could make the bullish turning point to reach the price level of another asset because they are supposed to move together in long run. We are in profit due to the sharp rise in the asset with low price (=Symbol B) after the bullish turning point.
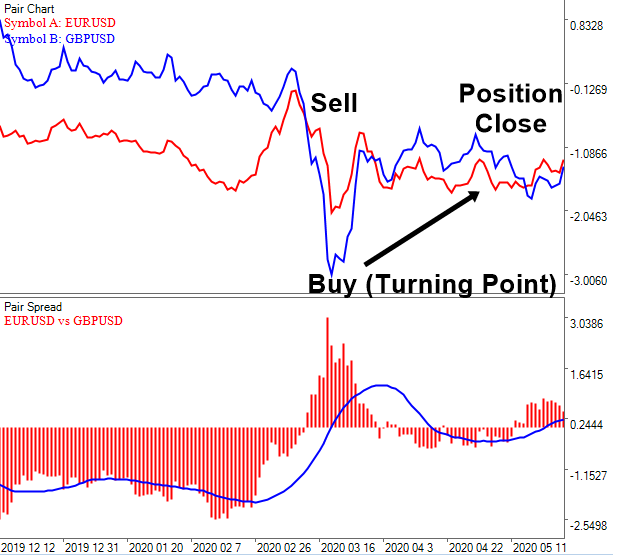
Figure 2-4: Normalized EURUSD vs GBPUSD on the top and spread chart on the bottom (Chart: www.algotrading-investment.com, Optimum Chart)
In the second example, the asset with high price (=Symbol B) could make the bearish turning point to reach the price level of another asset because they are supposed to move together in long run. We are in profit due to the sharp fall in the asset with high price (=Symbol B) after the bearish turning point.
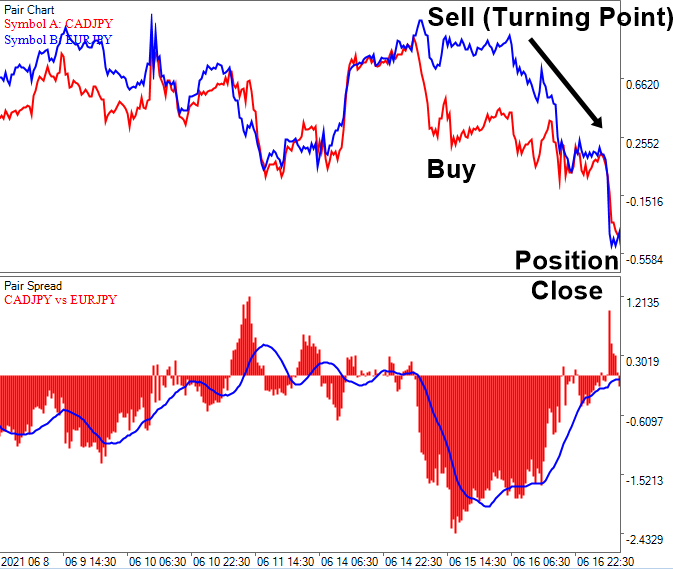
Figure 2-5: Normalized CADJPY vs EURJPY on the top and spread chart on the bottom (Chart: www.algotrading-investment.com, Optimum Chart)
From the two illustrative examples, we could draw two useful trading principle. Firstly, when the spread is sufficiently high, it is possible to have a turning point between two assets. The bullish turning point could happen to the asset with low price or the bearish turning point could happen to the asset with high price. As in value investing, the pairs trading provides an explanation to the formation of the turning point in the financial market. Secondly, taking the opposite positions on two assets reduce the risk of the market volatility. This is considered as the hedging or the risk neural strategy. Since we are holding one position in opposite direction to other position, we are exposed less on the market volatility. Although hedging is an optional practice only, you never know if you like or dislike such a trading principle. If you do not understand the hedging effect, you might open a Forex demo or simulation account for an educational purpose. Search two highly correlated assets. Then buy one and sell the other. Monitor the profits and loss of the two assets for some time.
In the Forex market, since you can enter the sell position as well as the buy position, the pairs trading can be applicable. The pairs trading can be applicable to the stock trading too. If the pairs trading strategy provides the high spread between two stocks in your portfolio, then you can sell the stock in your portfolio and buy more on the other stock in your portfolio. If the pairs trading strategy provides the high spread between one stock in your portfolio and the other stock outside your portfolio, then you can sell the stock in your portfolio and buy the new stock for your portfolio. Since the spread in the pairs trading is calculated in real time, it can be considered as the quantitative trading strategy. This helps us to trade with less emotion. In addition, the price pattern can be combined with the pairs trading strategy to improve their performance. In that case, the margin of safety in the pairs trading could be applied to confirm the direction of the price pattern. However, there are some disadvantages for the pairs trading too. For example, this technique might be more complicated than other trading strategy. Firstly, they could be more complicated because the technique involves dealing with two assets at the same time. Secondly, they could be more complicated because the technique requires some knowledge of statistics and statistical trading.
About this Article
This article is the part taken from the draft version of the Book: Science Of Support, Resistance, Fibonacci Analysis, Harmonic Pattern, Elliott Wave and X3 Chart Pattern. Full version of the book can be found from the link below:
You can also use Pairs Trading or Spread Analysis in MetaTrader to accomplish your technical analysis. Here is the landing page for Pairs Trading Station in MetaTrader 4 and MetaTrader5.
https://algotrading-investment.com/portfolio-item/pair-trading-station/
https://www.mql5.com/en/market/product/3303
https://www.mql5.com/en/market/product/3304
Below is the landing page for Optimum Chart, which is the standalone tool to scan the trading opportunities for all symbols and all timeframe in one button click.
https://algotrading-investment.com/2019/07/23/optimum-chart/
Related Products


