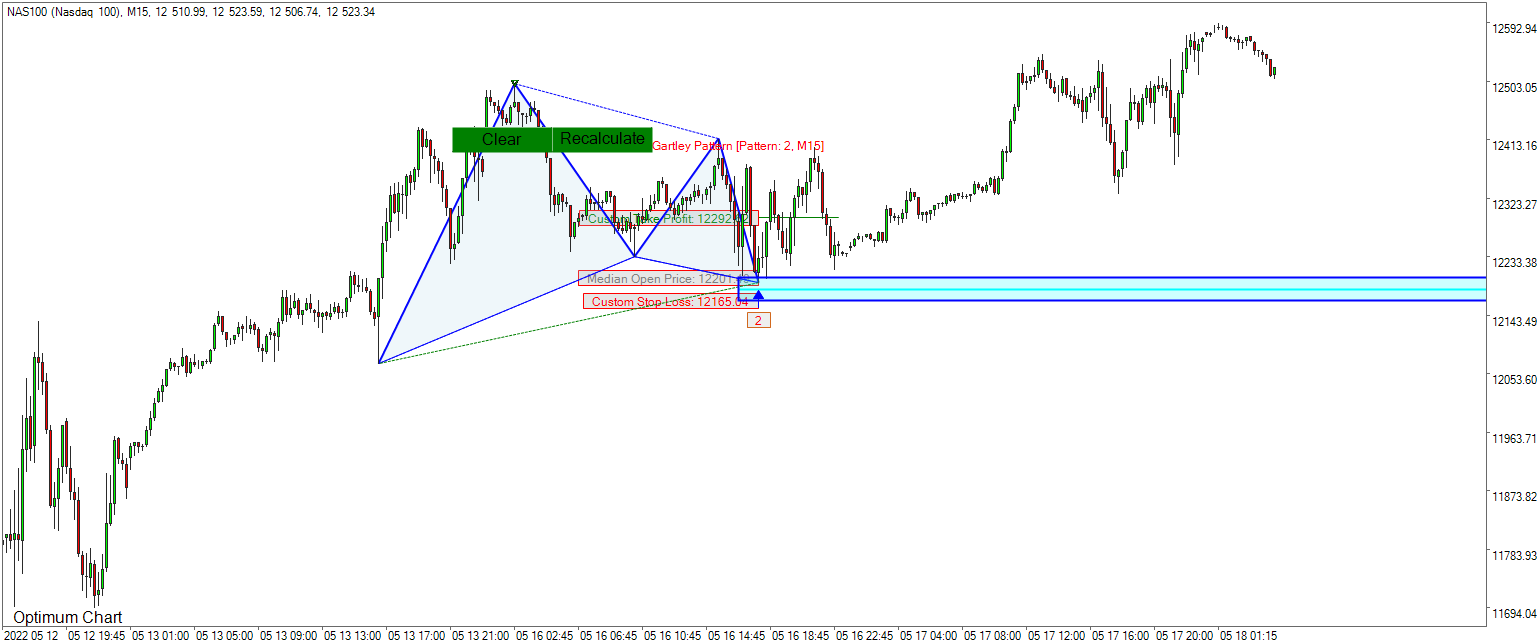
Gartley Pattern – Harmonic Pattern
This page provides the useful information for Gartley Pattern used in Forex and Stock market. Gartley Pattern is the Harmonic Pattern used by technical analyst. We uses non repainting and non lagging chart pattern detection algorithm. In addition, the pattern detection algorithm is synchrozined between history and live trading. Hence, this study will show both failed and successful pattern to provide the unbiased results, which is close to the real performance. Typically, a repainting indicator will show the successful pattern only making it hard to check the real performance of the chart pattern. Hence, you can not check the real performance of the chart pattern using the repainting indicator. With our pattern detection algorithm, you can trade what you see. That can be done by only one button click to scan entire possible patterns across all symbols.
If you want to become a profitable trader, you should study the strategy in the scientific manner. It basically involves checking the repeatability or reproducibility. We provide this study to enhance your forex and stock trading with the chart patterns. The testing results provide some scientific value for the Fibonacci pattern, Harmonic Pattern, X3 Chart Pattern and Elliott Wave Pattern too.
We used the Optimum Chart to test this pattern. You can also use X3 Chart Pattern Scanner in MetaTrader 4 and MetaTrader 5 to get similar results. However, the user interface between MetaTrader version and Optimum Chart version is different. X3 Chart Pattern Scanner in MetaTrader can scan multiple timeframes of one symbol for one indicator attachment whereas the X3 Chart Pattern Scanner in Optimum Chart can scan all symbols + all timeframe for one indicator attachment. Anyway, both version use the same pattern detection algorithm. Hence, both versions are equally powerful.
The Gartley Pattern in this study has the following Structure.
- N: 3, C0: 0.618 to T0: 3
- R0: 1.272, R1: 0.382 -0.886, R2: 0.618
Testing results were saved as the screenshots. The screenshots were taken when these ratios are met purely. No other indicator or confirmation were used to allow the fair comparison to other price patterns. For example, to compare the accuracy of Gartley Pattern to Butterfly Pattern, or to compare the accuracy of Harmonic pattern to Elliott Wave pattern, or to compare the accuracy of Harmonic pattern to X3 Chart pattern, etc. Remember the purpose of this work is to provide the most accurate price pattern to trade. Finding the most profitable chart pattern can be done only by comparing apple to apple meaning that each pattern should be compared under the same condition.
In practice, the trader never use the chart pattern alone to trade. Here are some points to watch out when you trade with the chart patterns.
- Price movement around the Pattern Completion Zone (= Trading Zone) in the chart pattern
- Risk management around the Trading Zone. Look for the trading entry, where at least, Reward > Risk x 2
- Possibility for breakout trading around the trading zone (=use them as support and resistance)
- Look for continuation pattern vs reversal pattern
We recommend these books to find out how to increase the success rate when you trade with these chart patterns.
- Science Of Support, Resistance, Fibonacci Analysis, Harmonic Pattern, Elliott Wave and X3 Chart Pattern (In Forex and Stock Market Trading)
- Guide to Precision Harmonic Pattern Trading (Mastering Turning Point Strategy for Financial Trading)
- Technical Analysis in Forex and Stock Market (Supply Demand Analysis and Support Resistance)
- Profitable Chart Patterns in Forex and Stock Market (Fibonacci Analysis, Harmonic Pattern, Elliott Wave, and X3 Chart Pattern)
- Scientific Guide to Price Action and Pattern Trading (Wisdom of Trend, Cycle, and Fractal Wave)
Here is the PDF document presenting Gartley Pattern In Forex Market.
https://algotrading-investment.com/manual/pricepattern/Gartley%20Pattern%20in%20Forex.pdf
Here is the PDF document presenting Gartley Pattern in Stock Market.
https://algotrading-investment.com/manual/pricepattern/Gartley%20Pattern%20in%20Stock%20Market.pdf
Here is the YouTube Video for Gartly Pattern in Forex Market.
Here is the YouTube Video for Gartley Pattern in Stock Market.
Gartley Pattern Detection was performed using the Robo Advisor built inside Optimum Chart.
https://algotrading-investment.com/2019/07/23/optimum-chart/
You can also check the similar results using the X3 Chart Pattern Scanner in MetaTrader 4 and MetaTrader 5 platform (Non repainting and non lagging algorithm).
https://www.mql5.com/en/market/product/41993
https://www.mql5.com/en/market/product/41992
https://algotrading-investment.com/portfolio-item/profitable-pattern-scanner/
Harmonic Pattern Plus is the repainting Harmonic Pattern Scanner with tons of powerful features at affordable cost.
https://algotrading-investment.com/portfolio-item/harmonic-pattern-plus/
https://www.mql5.com/en/market/product/4488
https://www.mql5.com/en/market/product/4475
Harmonic Pattern Scenario Planner is the advanced repainting Harmonic Pattern Scanner with tons of powerful features at affordable cost.
https://algotrading-investment.com/portfolio-item/harmonic-pattern-scenario-planner/
https://www.mql5.com/en/market/product/6101
https://www.mql5.com/en/market/product/6240
Related Products


