Turning Point Prediction After Two Years Usage
This chapter reviews the new turning point prediction method introduced in this book after using them for two years in the Forex and Stock market as a technical analysis. Just like any creation or discovery in history, new mathematical method requires a continuous monitoring in the real-world application to be useful. Hence, this chapter is about to share the accumulated information about this new turning point prediction method for the audience, interested in Forex and Stock market trading.
The new turning point prediction method consists of the turning point probability and fractal cycle analysis. In fact, the turning point probability and fractal cycle analysis are integrated in the calculation phase of this turning point prediction method. Several terminologies can describe their application. We ordered the terminologies by their word length.
- Geometric volatility
- Quantified price action
- Fractal wave modelling
- Stochastic cycle modelling
- Geometric analysis combined with statistics
- Peak and trough analysis combined with statistics
- Fractal decomposition or Fractal wave decomposition
- Price action combined with math or mathematical price action
The above terminologies can be applied to describe the application of the turning point probability and fractal cycle analysis in real world. However, some of the terminology can appeal more to different audience. For example, “stochastic cycle modelling” might be more appealing to the forecasting scientist as they knew some data are more complex beyond the deterministic cycles. Likewise, for the day trader, “price action combined with math” or “mathematical price action” might be more appealing to them if they heard about the price action. Especially, the term “geometric volatility” might provide a lot of insight behind this prediction algorithm to mathematician, even though they have not read this book at all.
Whichever the terminology is more appealing to you, the purpose of the turning point probability and fractal cycle analysis is to predict the highly complex data like the price series in Forex and Stock market. Although we have introduced many usage examples of the turning point probability and fractal cycle analysis in this book, we have provided much simpler guide for the day trading past two years. In the day trading, the trader requires to do multiple tasks in short period of time. Hence, the simple and effective decision making is important for their trading operation. To provide the simple but powerful prediction method, we recommended using the turning point prediction with support and resistance in the technical analysis. Support and resistance are often used when the trader wants to find out breakout or reversal trading opportunity at the specific price level. This technique is typically considered as the market reaction strategy when they are used on their own. In this market reaction strategy, the trader uses the support resistance to find out the direction in which the price is getting pushed by the crowd. So, around support and resistance, we can have both reversal and breakout trading opportunity depending on the buying and selling volume created by the crowd.
When the support and resistance are combined with the turning point probability, the market reaction strategy now becomes the market prediction strategy. The market prediction strategy means that the trader can anticipate in which direction the price can move at the support and resistance. For example, instead of waiting to see some significant price movement in one direction, the trader can predict the price direction even before the price approach near the support or resistance.
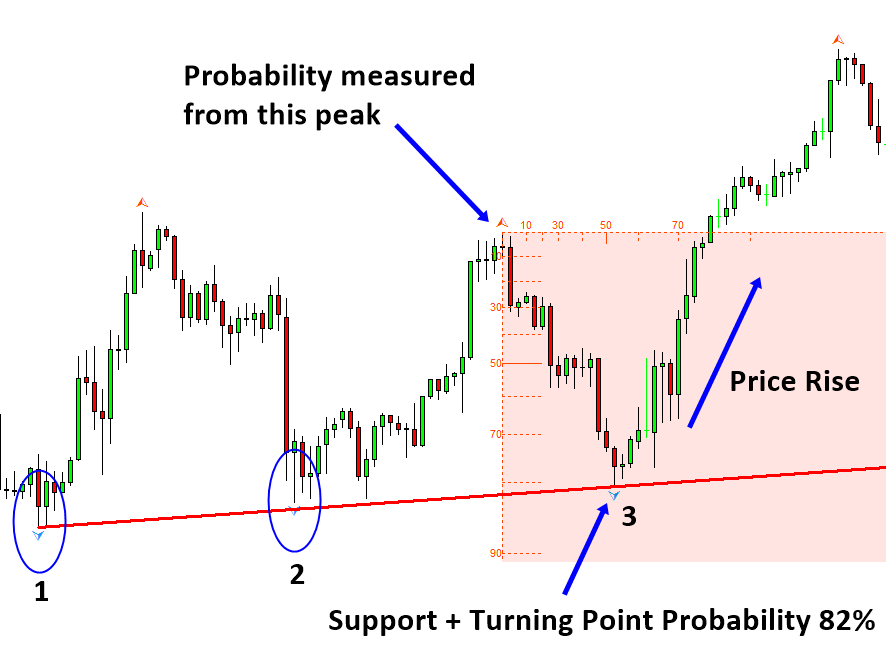
Figure 13-1: Turning point probably 82% at the support on S&P 500 Index H1 chart
This market prediction strategy has several advantages over the market reaction strategy. Many traders are feeling tired of using market reaction strategy because they have to wait in front of the computer screen too long until they see some significant price movement in one direction. When they use the turning point probability to predict the market direction with support and resistance, their trading operation involves much less time to make the buy and sell decision.
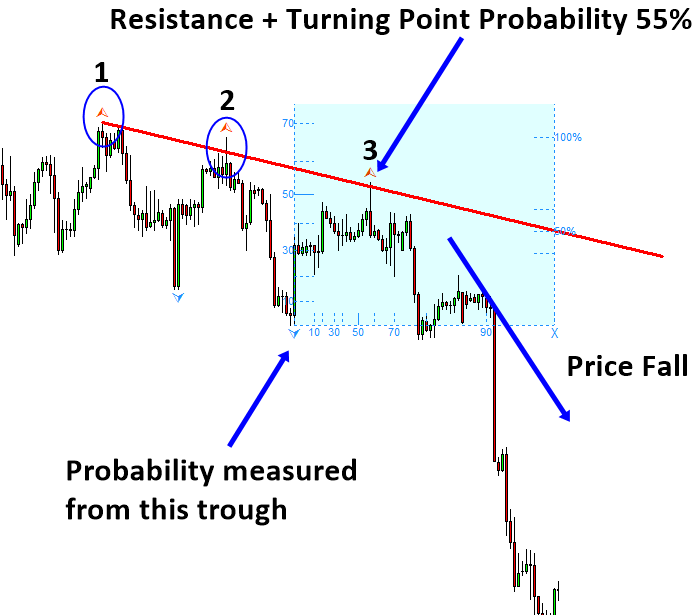
Figure 13-2: Turning point probably 55% at the resistance on EURUSD H4 chart
In addition, the price tends to move extremely fast when the price starts to reveal their direction. Hence, even though you have waited long time around support or resistance level, the chance of buying at low price or selling at high price can be thin with the market reaction strategy. You just need to be really fast and accurate to get the early entry before other people act. When you predict the market direction with the turning point probability, this helps to get early entry. You have the better chance to get early entry as you have some clue about the market direction from the turning point probability. This can provide a solid advantage to your trading as you can achieve high reward with less effort.
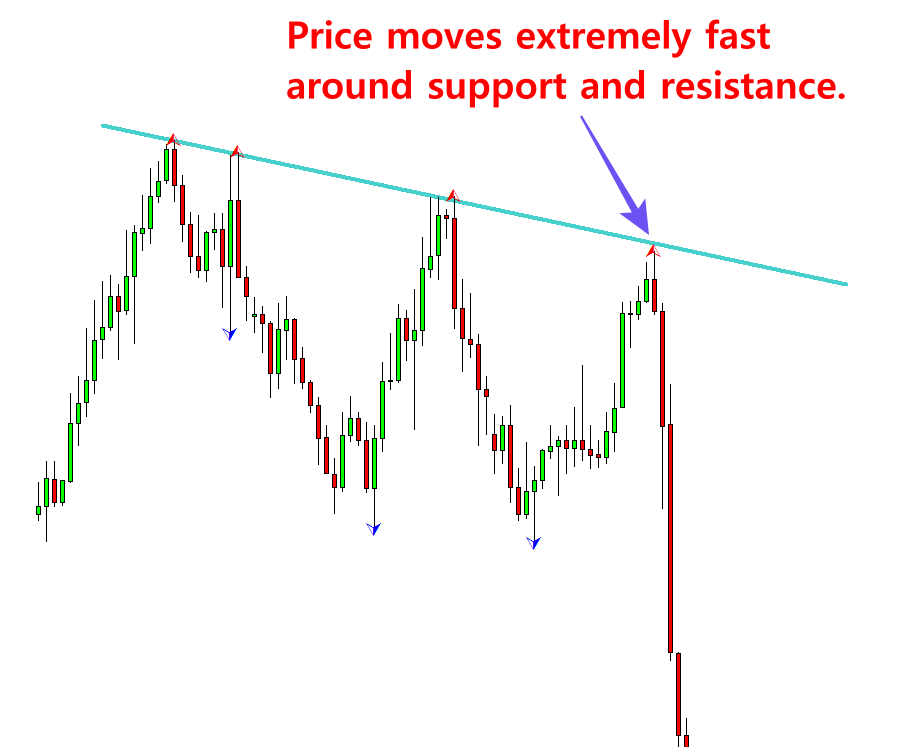
Figure 13-3: Fast price movement around resistance
The turning point probability can be combined with the supply demand zone too. Supply demand zone is the technical analysis that extends the capability of the support and resistance. Supply demand zone is similar to support and resistance with several distinctive points. One difference between them is the supply demand zone uses area, also known as trading zone, instead of line.
Figure 13-4: Supply zone example on S&P 500 H1 timeframe
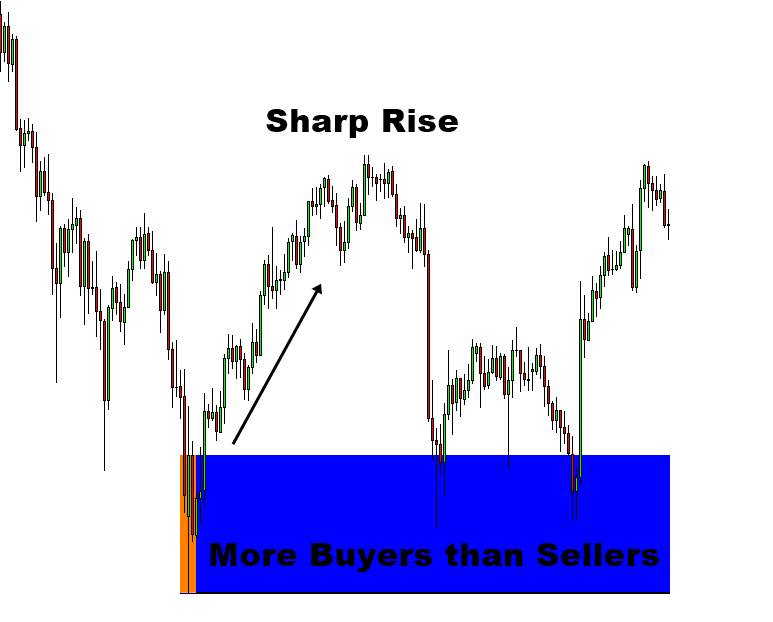
Figure 13-5: Demand zone example on Ethereum H1 timeframe
But you will often find the supply demand zone look similar to the support and resistance in the chart. Trading zone in the supply demand analysis tends to provide much simpler entry and risk management comparing to the price level in support and resistance. Hence, this is another popular trading strategy for the seasoned day trader.
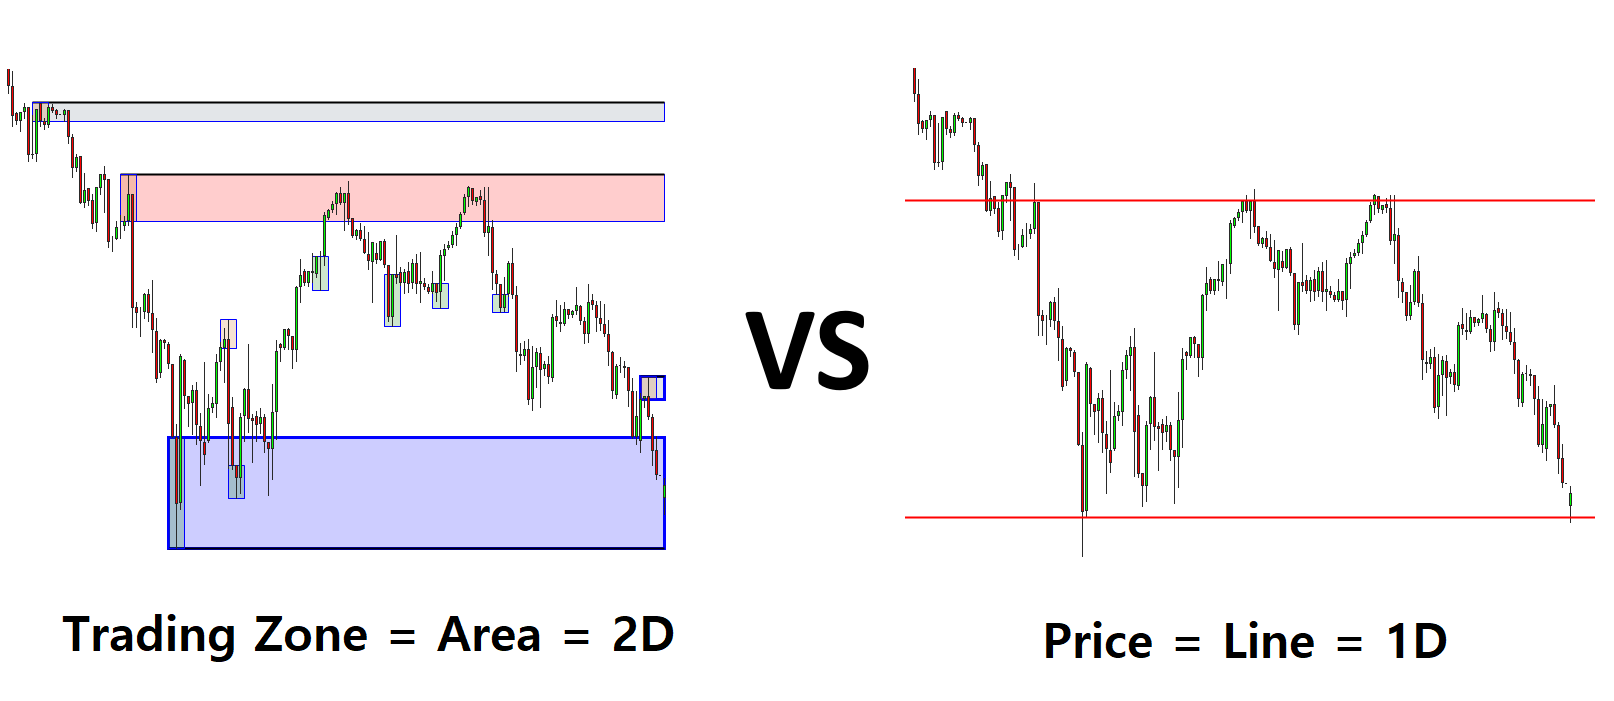
Figure 13-6: Supply Demand Zone (Left) vs Support and Resistance (Right)
We can apply the turning point probability with the supply demand zone without too much complication. For example, we can predict buy signal when the turning point probability is high at the demand zone.
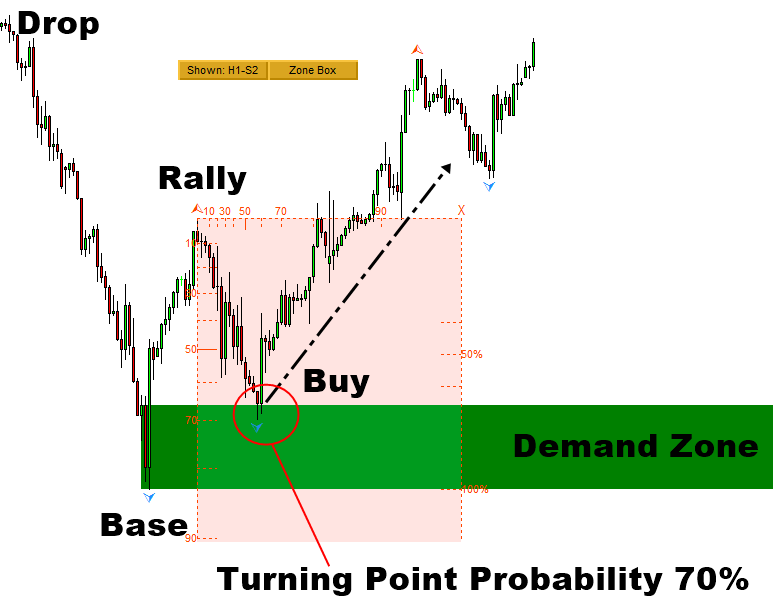
Figure 13-7: S&P 500 index H1 timeframe
Likewise, we can predict the sell signal when the turning point probability is high at the supply zone. For both supply demand zone, we recommend to see the turning point probability greater than 50%. This 50% turning point probability criteria is the same for the support and resistance too. Typically, higher turning point probability will provide high probability to win. Hence, if you want to increase your success rate, you can trade with high turning point probability around the support resistance as well as the supply demand zone.
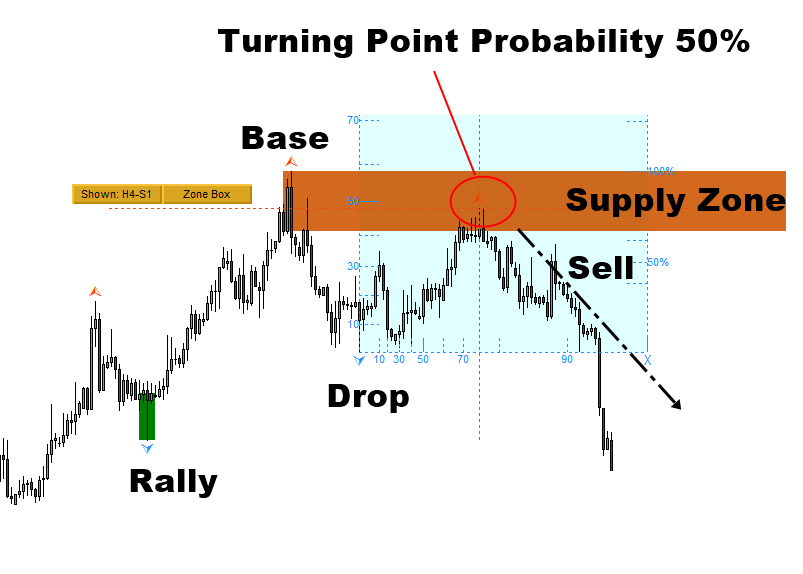
Figure 13-8: Gold against US Dollar (=XAUUSD) H4 timeframe
So far, we have showed how to combine the turning point probability for the geometric support and resistance. However, the idea of combining the turning point probability with support and resistance can be extended for the non-geometric support and resistance too. For example, the turning point probability can be combined with the pivot point analysis and the round number, which are considered non geometric. You can use the turning point probability to confirm your trading direction and to quantify the risk associated with your entry around these support and resistance levels too.
Although using the turning point probability is simple and straight forward in practice, some starters find it difficult to understand how to read the turning point probability in their chart. Firstly, you need to understand that the turning point probability graph is shown as a rectangle or a box in the chart. This rectangle or box will help you to measure the turning point probability from peak to trough or from trough to peak in your chart. The box can be drawn from a peak or from a trough. If we want to measure the turning point probability at the current peak, then the box will be drawn from the previous trough.
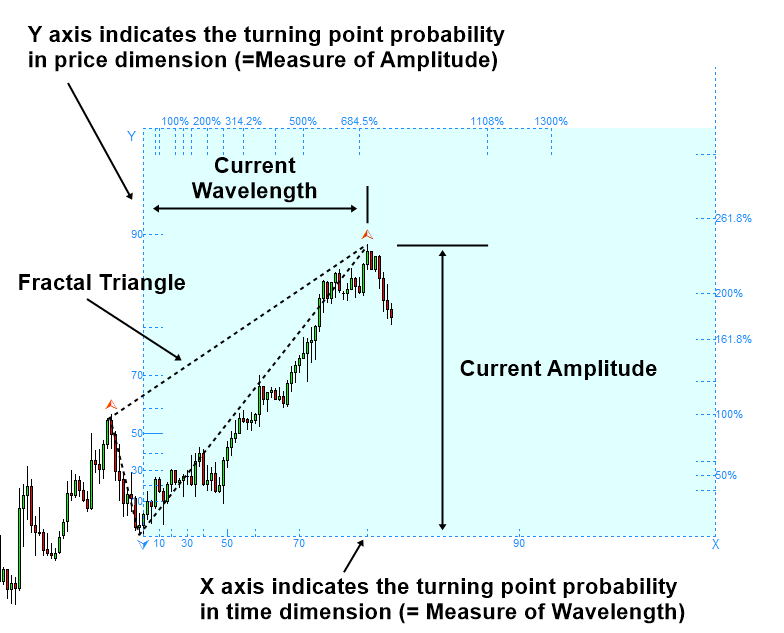
Figure 13-9: Fibonacci Probability Graph measuring probability for the peak
Likewise, if we want to measure the turning point probability at the current trough, then the box will be drawn from the previous peak. Left axis in the box is used to measure the turning point probability in price dimension. Hence, the left axis is the most used part. 10, 30, 50, 70 and 90 in the left axis indicates the turning point probability 10%, 30%, 50%, 70% and 90%. Basically, 10% turning point probability indicates the low chance for the price to turn. 90% turning point probability indicates the high chance for the price to turn.
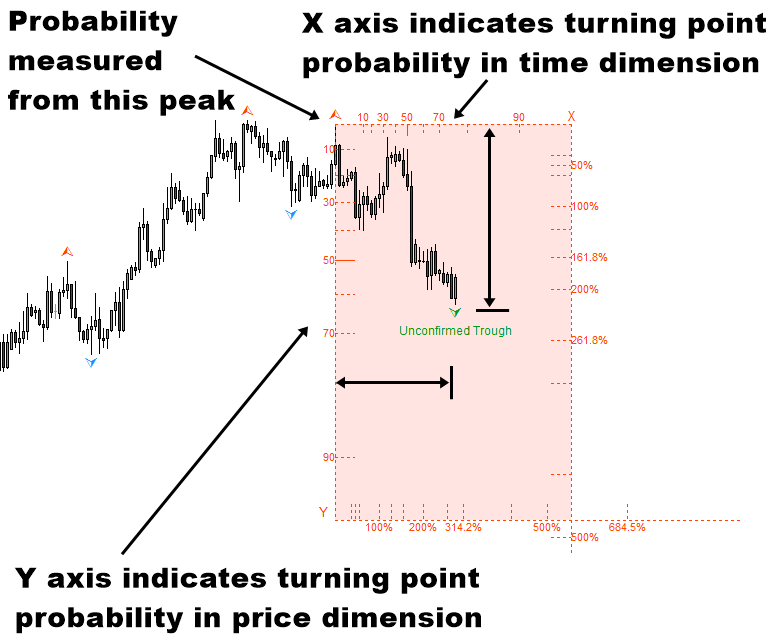
Figure 13-10: Turning point probably 62% example for trough
Some people find it hard to read the turning point probability in the box because the reading is the other way around for the case of peak and trough. However, in Forex and Stock chart, sell signal is always mirrored against the horizontal axis. For example, the head and shoulder pattern will be mirrored against the horizontal axis for buy and sell signals. Hence, head and shoulder pattern is used for sell signal and the inversed head and shoulder pattern is used for buy signal. Likewise, falling wedge pattern and rising wedge pattern are mirrored against the horizontal axis too.
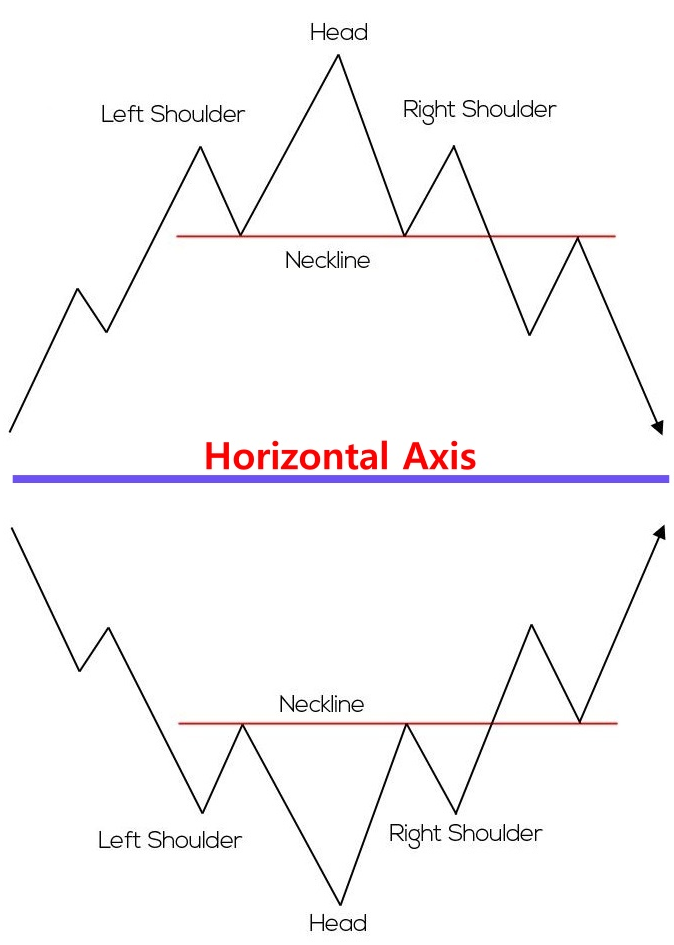
Figure 13-11: Head and shoulder pattern and inversed head and shoulder pattern
Hence, the reading for the turning point probability starts from the top left of the box to bottom left when the turning point probability of the trough is measured. Likewise, the reading for the turning point probability starts from bottom left of the box to top left when the turning point probability of the current peak is measured. This mirroring against the horizontal axis is a natural thing in the Forex and Stock chart. Like this, the turning point probability can be measured in any peak or trough in your chart. Hence, turning point probability can be considered as “Price action combined with math” or “mathematical price action” or “Quantified Price action”. The turning point probability is useful to quantify the accuracy of your entry. It is also helpful to quantify the risk associated with your entry.
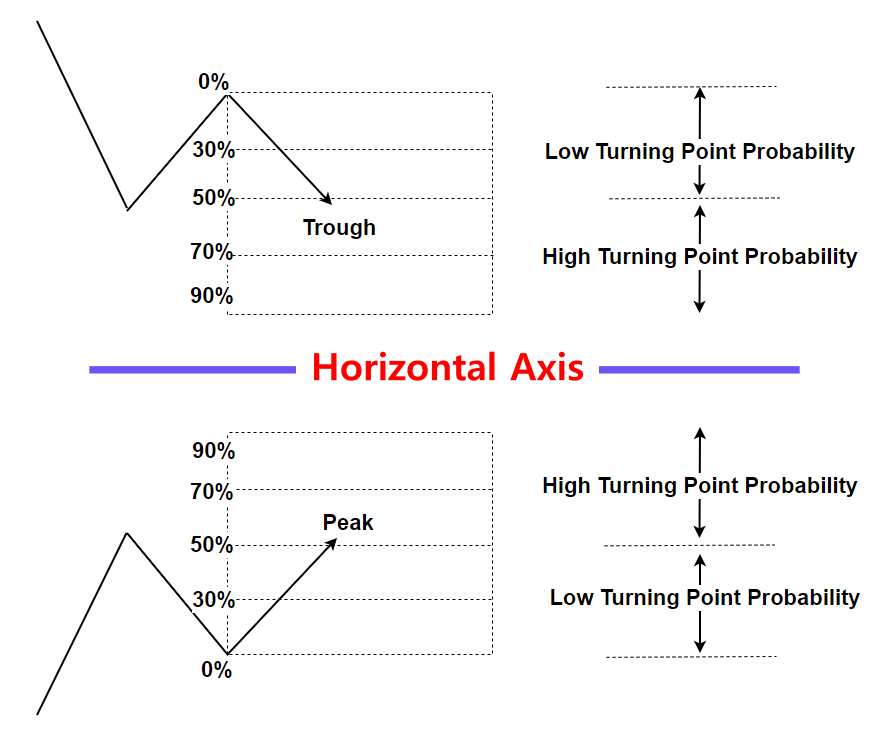
Figure 13-12: Turning point probability graph mirrored against horizontal axis
One very interesting observation we made in past two years is the potential usage of the turning point probability and fractal cycle analysis for the economist and the policy maker. For this point, we need to understand Fractal cycle analysis. Fractal cycle analysis is based on the fractal decomposition. Basically, it extracts small and large cycle one by one from fractal wave, the price series in Forex and Stock market.
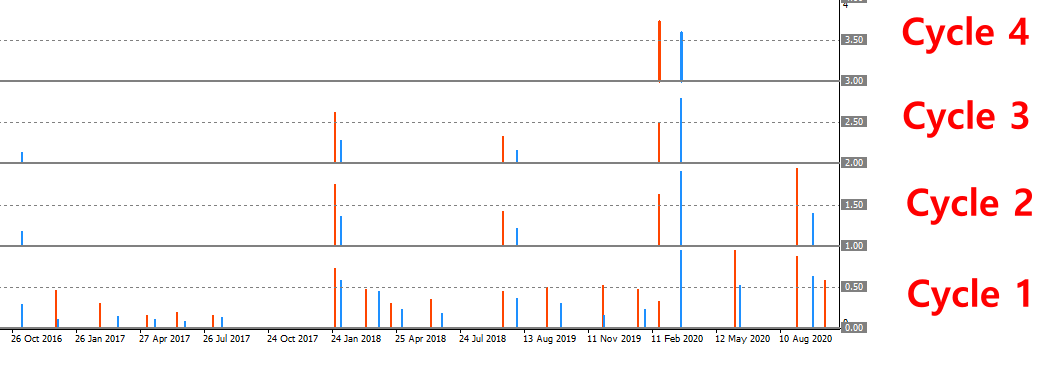
Figure 13-13: Fractal cycle analysis example (Cycle 1 = smallest cycle on the bottom)
This process is very similar to other cycle analysis like the cycle extraction based on Fourier transformation, wavelet decomposition, Singular Spectrum Analysis and so on. However, one important distinctive point of the fractal cycle analysis from them is that this method was born to model the stochastic cycles not the deterministic cycles. This prediction method is suitable if the data possess highly complex patterns. Forex and stock market data are very good example of the data with highly complex patterns.
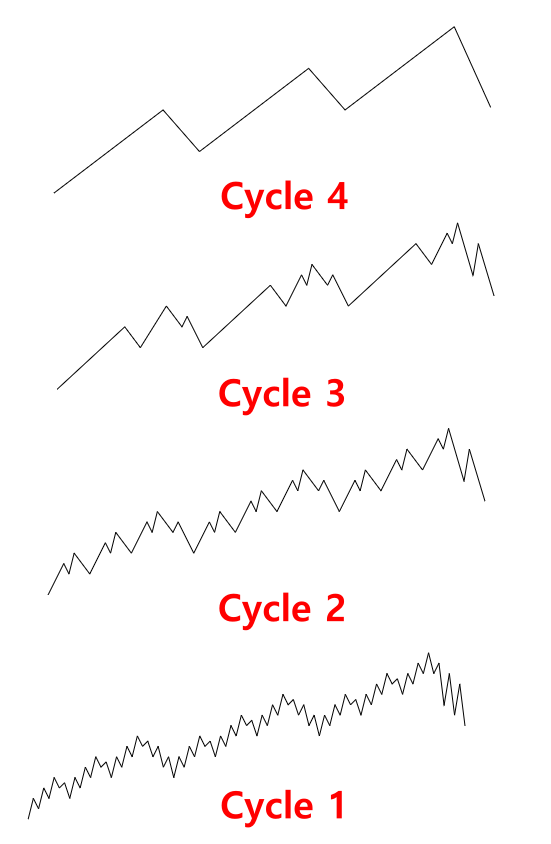
Figure 13-14: Fractal cycle analysis concept (Cycle 1 = smallest cycle on the bottom)
For trading, we typically recommend to pay attention to the turning point probability at cycle 1 and cycle 2. This is because we believe that these two cycles provide the swing trading opportunity for the trader. However, this does not mean that you have to limit your potential to work with other cycles. You can even unlock cycle 3 and cycle 4 for your trading too. For example, in the Fractal Pattern Scanner, the software implemented with the turning point probability and fractal cycle analysis, cycle 3 and cycle 4 can be unlocked by following three steps.
- Set Fractal Decomposition = 4
- Set enough bars to cover the historical price at your interest
- Turn off Mother Wave detection
After above three steps, you can access cycle 3 and cycle 4 from your chart. Of course, it is possible to extract cycle 5 or cycle 6 in theory. However, at the moment, the software only provides up to cycle 4. In my opinion, cycle 3 and cycle 4 look huge enough to foresee any macroeconomic activity for the economist and policy maker.
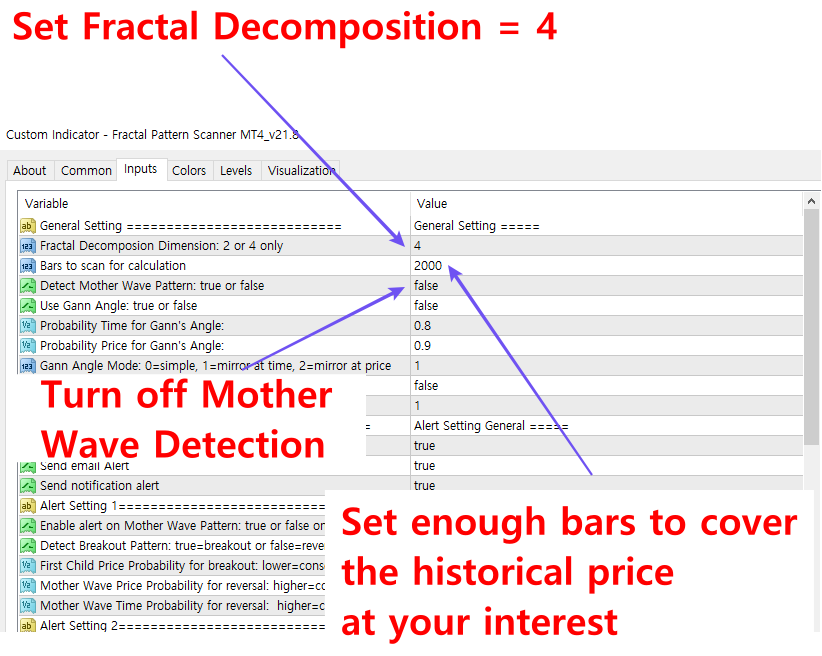
Figure 13-15: Steps to use the Fractal Pattern Scanner as the pure turning point analysis tool
One interesting observation we made past two years is that the cycle 4 predicted the stock market fall due to the Covid 19 pandemic and the stock market rise after the Covid 19 pandemic. For example, in February 2020, the turning point probability was 72% at cycle 4 in Standard & Poor 500 index. Then the US stock market made a fast decline.
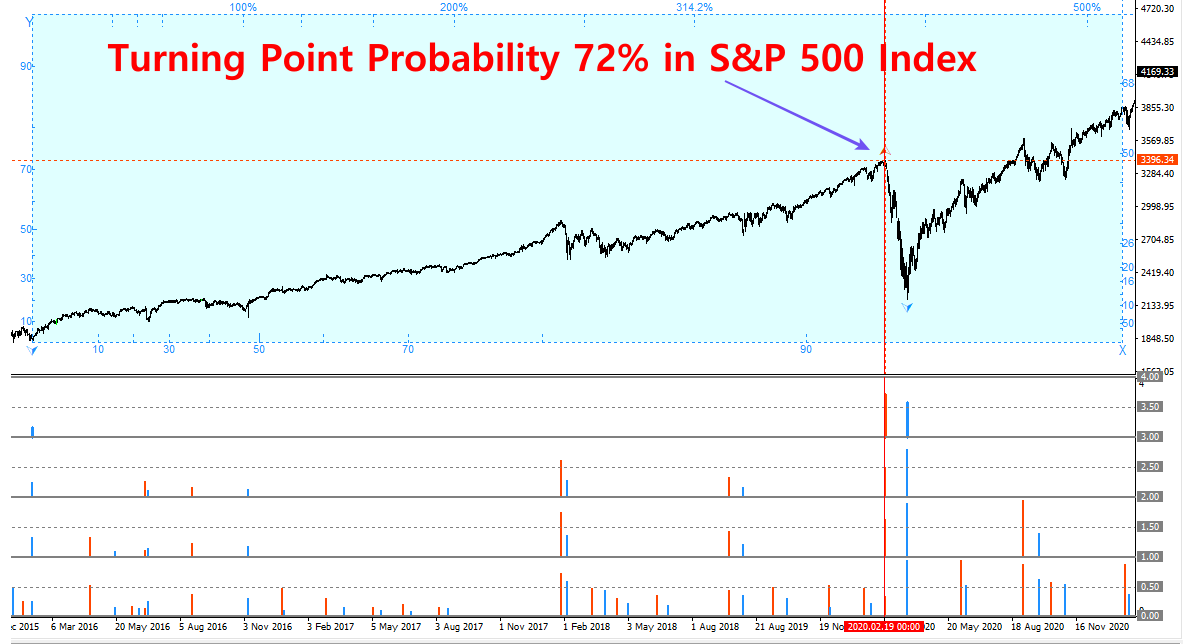
Figure 13-16: Turning point probability 72% in Standard & Poor 500 index in February 2020 (Daily Chart)
Likewise, in March 2020, the fractal cycle analysis showed the turning point probability 59% at cycle 4 in the Standard & Poor 500 Index. Then the US stock market started to recover until the Russia and Ukraine War at 24 February 2022.
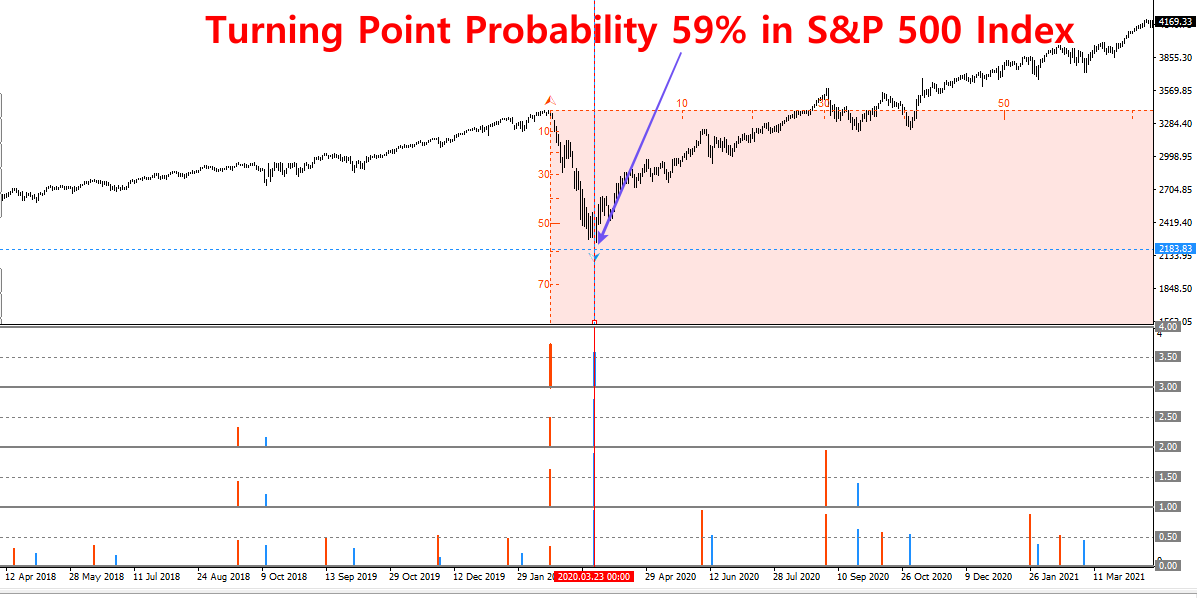
Figure 13-17: Turning point probability 59% in Standard & Poor 500 index in March 2020 (Daily Chart)
Another interesting observation came just before the Russia and Ukraine War at 24 February 2022. In fact, the turning point probability was over 90% at cycle 4 in Standard & Poor 500 Index. One interesting fact is that S&P 500 index started to decline in January 2022 not in February 2022. There could be various theory behind this. For example, S&P 500 Index might enter the corrective phase on January 2022 to balance the two years sharp rise and then the war started. Another possibility might be some investors might feel the risk of war between Russia and Ukraine by assessing the political situations in the two countries in January 2022. Whatever the true story is the highest turning point at cycle 4 was observed at January 2022 not in February 2022.
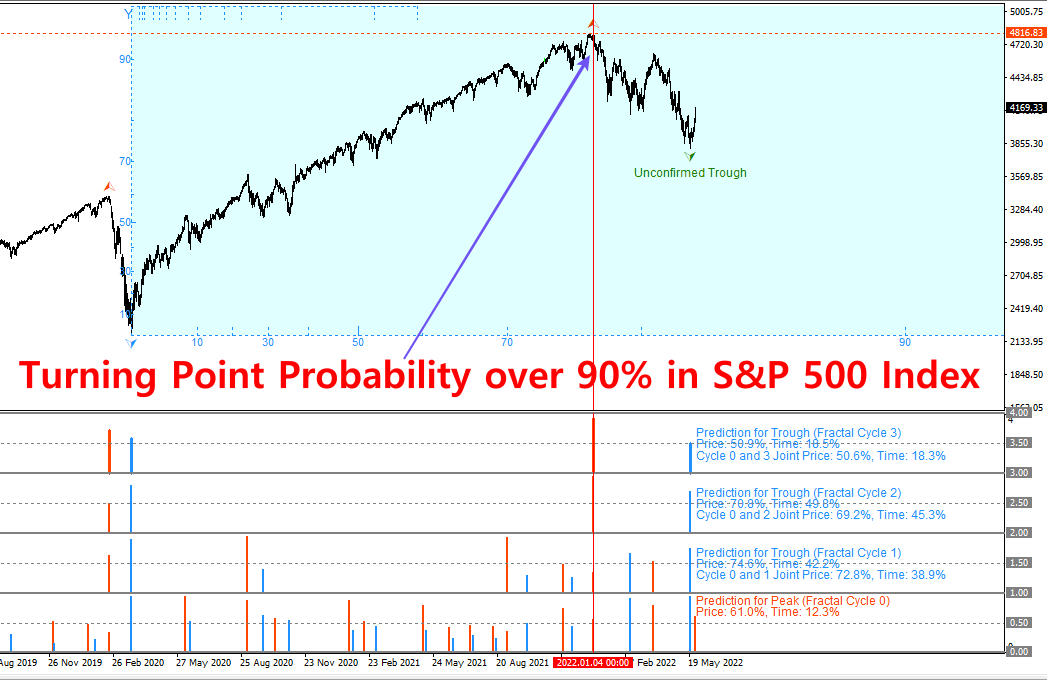
Figure 13-18: Turning point probability 90% in Standard & Poor 500 index in January 2022 (Daily Chart)
Fractal cycle analysis will not provide the reason for the turning point in the economic activity. However, it can provide the valuable information for the economist and policy marker if it is used together with other economic indicators.
Finally, the turning point probability and fractal cycle analysis are the unique prediction method combining the geometric analysis and statistics. As demonstrated, it can predict the turning point of the macroeconomic activity with bigger cycles. This information can be valuable for the investor and the economist. However, if you want to use it to make money as a trader or investor, then we recommend using the turning point probability in the conservative manner. For example, take the 90% turning point probability as the maximum. Financial market is a place with high uncertainty. It is not the place where someone can predict tomorrow’s stock price or someone can tell stock price will fall tomorrow with 95% or 99% accuracy. Hence, even though the reading of the turning point probability might reach over 95% or 99%, we will recommend to take them as 90% accuracy only.
About this Article
This article is the part taken from the draft version of the Book: Predicting Forex and Stock Market with Fractal Pattern. This article is only draft and it will be not updated to the completed version on the release of the book. However, this article will serve you to gather the important knowledge in financial trading. This article is also recommended to read before using Fractal Pattern Scanner, which is available for MetaTrader or Optimum Chart.
Below is the landing page for Fractal Pattern Scanner for MetaTrader 4 and MetaTrader 5. The same products are available on www.mql5.com too.
https://www.mql5.com/en/market/product/49170
https://www.mql5.com/en/market/product/49169
https://algotrading-investment.com/portfolio-item/fractal-pattern-scanner/
Below is the landing page for Optimum Chart
https://algotrading-investment.com/2019/07/23/optimum-chart/
Related Products


