Supply and demand analysis
Supply and demand analysis is known as several different names in the trading community like the supply demand analysis, demand supply analysis, supply demand zone trading, demand supply zone trading, and so on. In fact, all these various names are referring to the same trading strategy. We will use the name “supply and demand analysis” throughout this book. In essence, supply and demand analysis is one form of price pattern trading. The trading idea comes from understanding the supply and demand curve often appears in the Economic textbook. In fact, the supply demand analysis in trading involves to identify the price movement, which are caused by the unbalance in supply and demand. The practice does not require any math skills. However, it is more on the pattern recognition exercise with the chart.
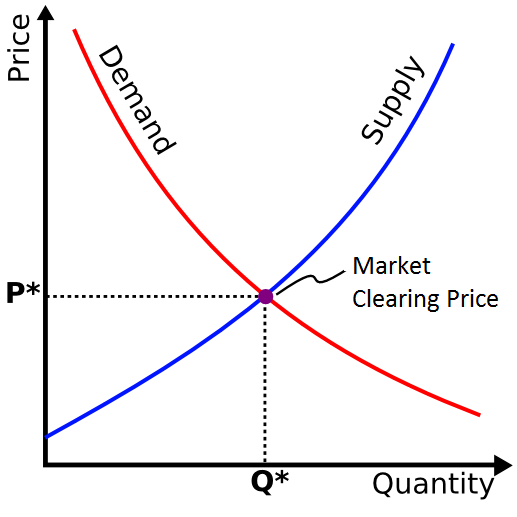
Figure 6-1: Supply Demand curve in Economics
In terms of the technical analysis history, the supply and demand analysis shares some common characteristics with the volume spread analysis (VSA) devised by Richard Wyckoff in 1930s. In the volume spread analysis, Richard Wyckoff believed that the market shows the sideways move before making a strong bullish rise or bearish fall. Practically, the sideways market can be analysed by several different methods including the statistical method and pattern recognition method. He pointed that this sideways movement is the key area for our trading. He named this key areas as accumulation and distribution respectively for bullish and bearish trading. The key area consists of two prices forming a box zone. Similarly, the supply and demand analysis involves defining the key area to trade.
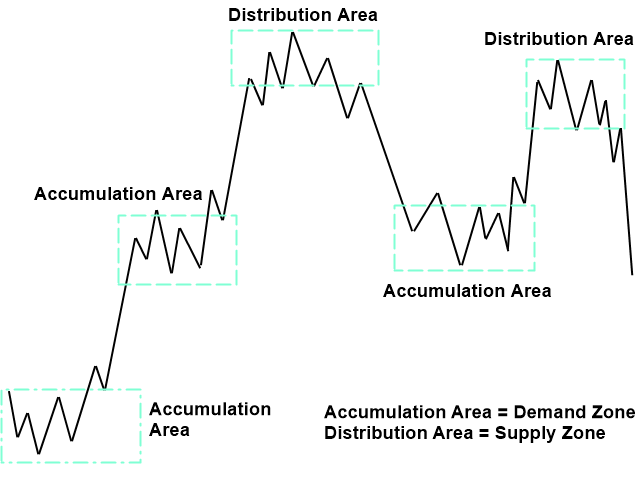
Figure 6-2: Schematic drawing of accumulation and distribution area in Volume Spread Analysis
In the practical trading, the supply and demand analysis involves identifying two key areas where supply is greater than demand (= supply zone) and where demand is greater than supply (=demand zone). Identifying the two key areas are done by looking at the price pattern. For example, supply zone is identified where the price drops at high speed from peak. Likewise, the demand zone is identified where the price rise at high speed from trough.
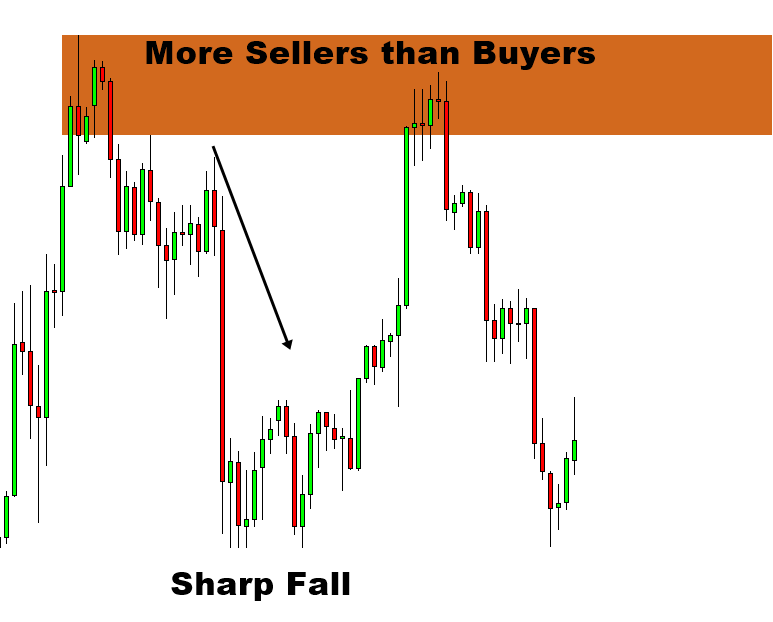
Figure 6-3: Supply example on S&P 500 H1 timeframe
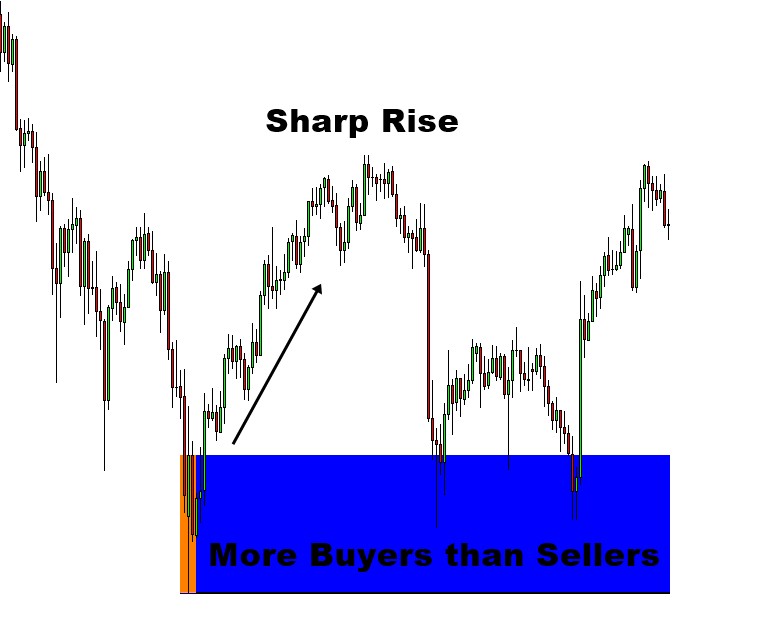
Figure 6-4: Demand example on Ethereum H1 timeframe (www.algotrading-investment.com)
In this book, I introduced this supply and demand analysis for two reasons. Firstly, the supply and demand analysis is simple and straightforward. There is nothing wrong with simple strategy as long as they are effective. Secondly, this is another trading strategy to predict the fractal wave in Forex and Stock market. In another words, this trading strategy is a good demonstration on how to predict fractal wave (i.e. market cycle) for the starter using the peak trough analysis.
Supply and demand analysis is comparable to support and resistance. Broadly speaking, supply and demand analysis can be considered as the support and resistance up to some extent. However, there are some differences between them. Firstly, support and resistance on their own are more or less volatility prediction tool. In another words, they predict the price level with potential high volatility. However, supply and demand analysis with the pattern recognition provides the direction to trade. For example, depending on the price pattern, the supply and demand analysis predicts the bullish or bearish movement. Secondly, support and resistance use the line whereas the supply and demand analysis use the key area, which is the price range between two prices. In spite of these two differences, there are some cases where supply and demand zone are formed in the similar way as the support and resistance. Hence, there could be some theoretical debate on using the supply and demand analysis as the support and resistance. However, this might be the interesting extension for the supply and demand analysis. Hence, we will discuss about this point in the later chapter of this book.
Now, let us have a look at the main elements of the supply and demand analysis. Supply and demand analysis involves identifying the price pattern. It is much easier to identify these price patterns with peak trough analysis as they can suggest the good entry and exit price at the top or bottom of the price cycle. In supply and demand analysis, we could perform two types of trading including reversal trading and continuation trading. In reversal trading, the price pattern for buy entry is called drop base rally pattern. The base is the short rest located between two strong movements. Typically, the base consists of few to several candle bars. In fact, the drop base rally pattern looks quite similar to double bottom pattern. If you find hard to recall the shape of the drop base rally pattern, you might recall the shape of double bottom pattern. However, the buy entry for the drop base rally pattern can be considered when the price touches the demand zone. In addition, the drop base rally pattern uses the demand zone to set the sensible size of price target and stop loss easier. These are the two important advantages for your trading over the typical trading with the double bottom pattern.

Figure 6-5: Schematic drawing of drop base rally pattern for reversal trading
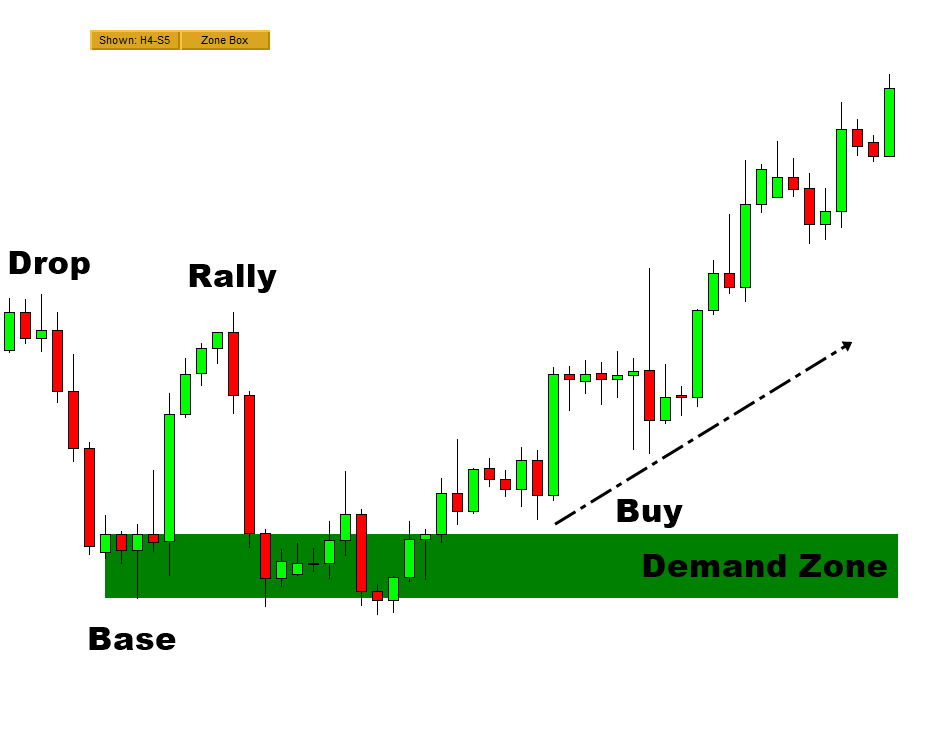
Figure 6-6: Drop base rally pattern on GBPUSD H4 timeframe
In reversal trading, the price pattern for sell entry is called rally base drop pattern. The base is the short rest located between two strong movements. Typically, the base consists of few to several candle bars. As you might guess, the rally base drop pattern looks similar to double top pattern. If you find hard to recall the shape of the rally base drop pattern, you might recall the shape of double top pattern. However, the sell entry for the rally base drop pattern can be considered when the price touches the supply zone. In addition, the rally base drop pattern uses the supply zone to set the sensible size of price target and stop loss easier. These are the two important advantages for your trading over the typical trading with the double top pattern.
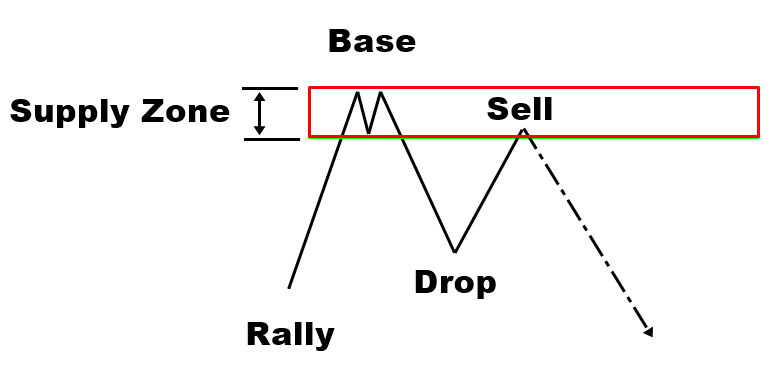
Figure 6-7: Schematic drawing of rally base drop pattern for reversal trading
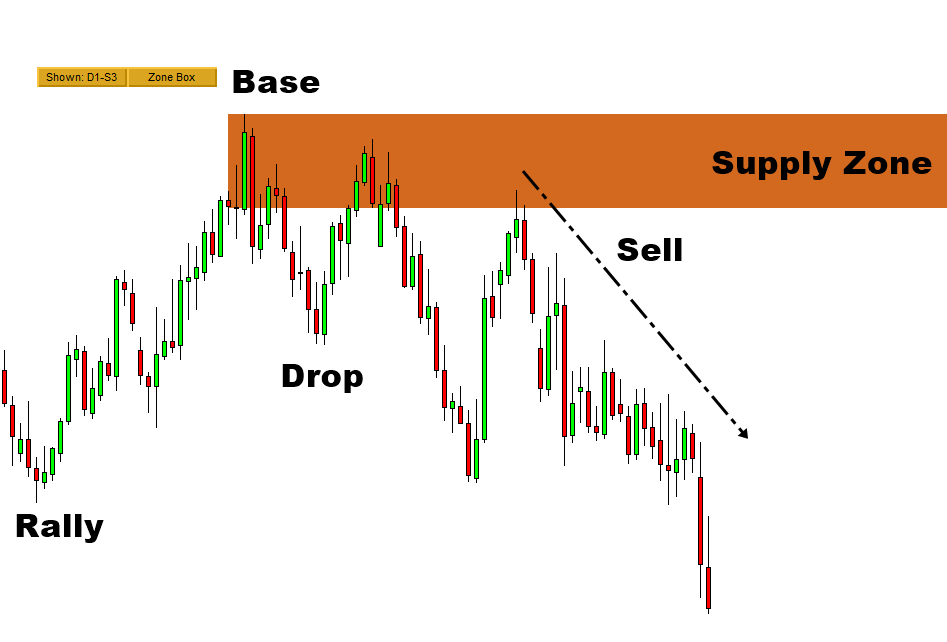
Figure 6-8: Rally base drop pattern on GBPUSD H4 timeframe
In continuation trading, the price pattern for buy entry is called rally base rally pattern. It is the key point to observe two sharp rises in price with some short rest in the middle (i.e. base). The buy entry is nearly identical to the case of reversal buy trading. We can consider the buy entry when the price touches the demand zone. In addition, the profit target and stop loss setting is nearly identical to the case of reversal buy trading too.
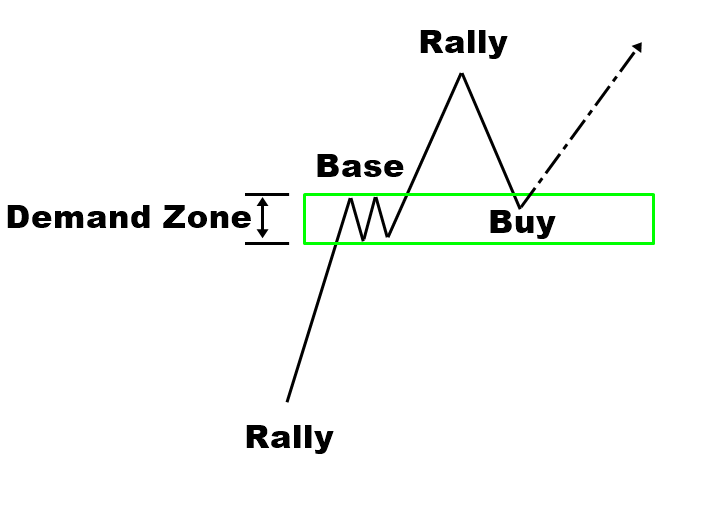
Figure 6-9: Schematic drawing of rally base rally pattern for continuation trading
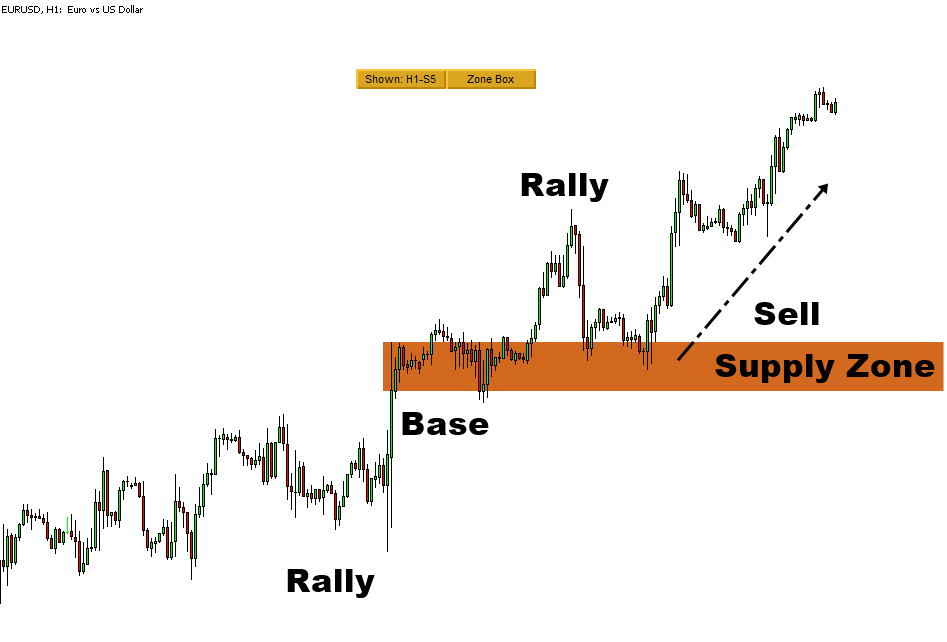
Figure 6-10: Rally base rally pattern on EURUSD H1
In continuation trading, the price pattern for sell entry is called drop base drop pattern. It is the key point to observe two sharp falls in price with some short rest in middle (i.e. base). The sell entry is nearly identical to the case of reversal trading. We can consider the sell entry when the price touches the supply zone. In addition, the profit target and stop loss setting is nearly identical to the case of reversal buy trading too.
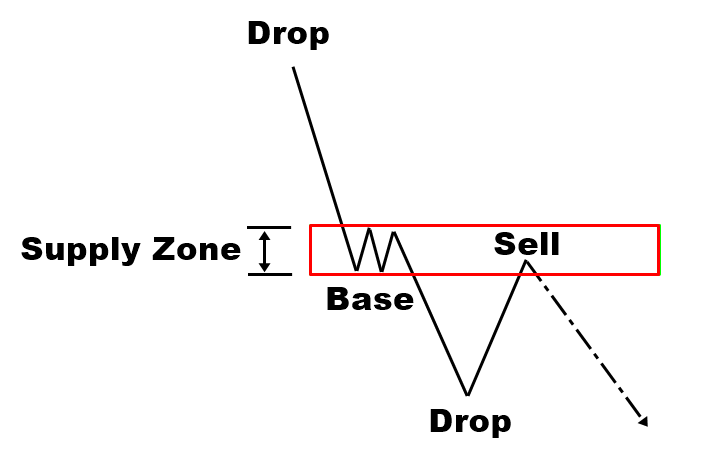
Figure 6-11: Schematic drawing of drop base drop pattern for continuation trading
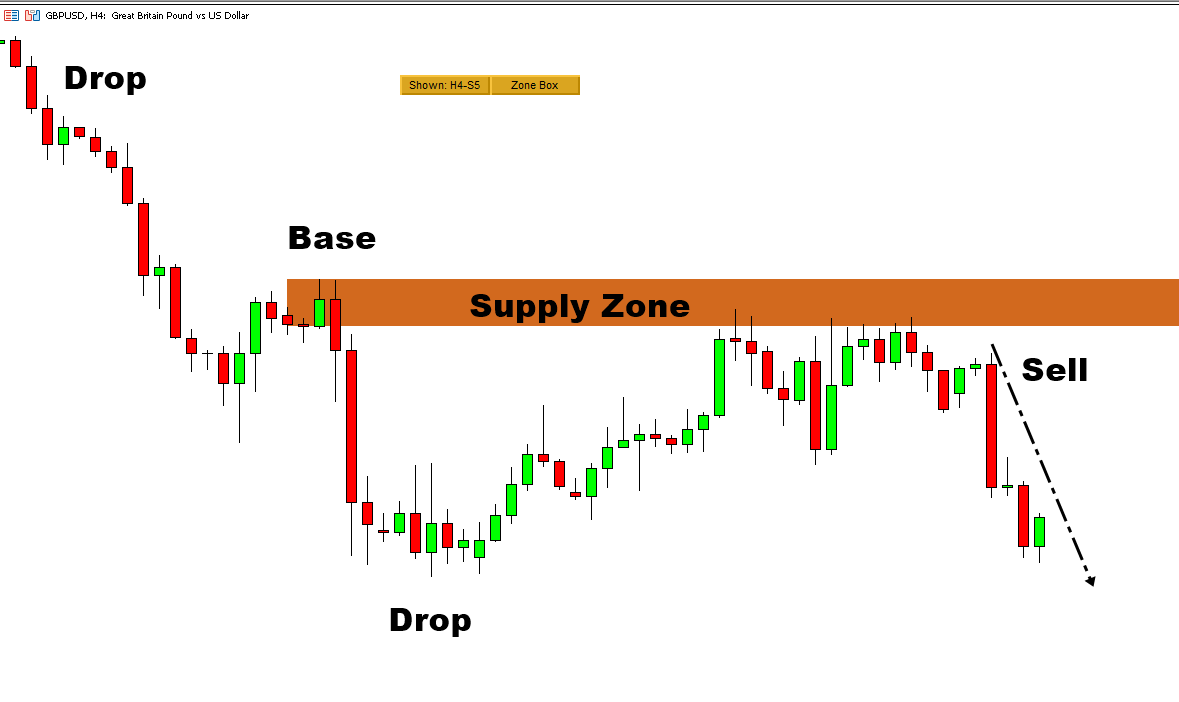
Figure 6-12: Drop base drop pattern on GBPUSD H4 timeframe
About this Article
This article is the part taken from the draft version of the Book: Technical Analysis in Forex and Stock Market (Supply Demand Analysis and Support Resistance). Full version of the book can be found from the link below:
https://algotrading-investment.com/portfolio-item/technical-analysis-in-forex-and-stock-market/
You can also use Ace Supply Demand Zone Indicator in MetaTrader to accomplish your technical analysis. Ace Supply Demand Zone indicator is non repainting and non lagging supply demand zone indicator with a lot of powerful features built on.
https://www.mql5.com/en/market/product/40076
https://www.mql5.com/en/market/product/40075
https://algotrading-investment.com/portfolio-item/ace-supply-demand-zone/
Turning Point Probability and Trend Probability can be measured with Fractal Pattern Scanner at every price action in your chart. For your information, beside the probability check up, there are many other powerful features built inside the Fractal Pattern Scanner. Below is the landing page to Fractal Pattern Scanner in MetaTrader 4 and MetaTrader 5.
https://www.mql5.com/en/market/product/49170
https://www.mql5.com/en/market/product/49169
https://algotrading-investment.com/portfolio-item/fractal-pattern-scanner/
Related Products


