How Testing Results Were Produced
To compare the performance of each pattern, we calculate their success rate over historical data with the chosen Reward/Risk ratio. We do this for multiple instruments and over 5 years of data. Then we calculate the statistical profit based on the success rate of each pattern using following equation:
- Statistical Profit per 10 dollar Risk (per trade) = Reward x Probability of Win – Risk x Probability of Loss = Expected Earning – Expected Loss
where we substitute 10 dollar as the Risk, hence we calculate Statistical Profit per 10 dollar risk. To account for any commission and slippage (i.e. probably two ways), we adjusted the value of Statistical Profit by subtracting 5% (0.5 dollar) of 10 dollar. Likewise, we can also adjust the value of Statistical Profit by 10% of our Risk by subtracting 1.0 dollar from calculation.
- 5% adj Statistical Profit per 10 dollar Risk (per trade) = Statistical Profit – 0.5 dollar.
- 10% adj Statistical Profit per 10 dollar Risk (per trade) = Statistical Profit – 1.0 dollar.
Simply speaking, patterns with higher Statistical profit can be considered as more profitable patterns in long run. Just use this Statistical value to get the relative performance of pattern against other patterns.
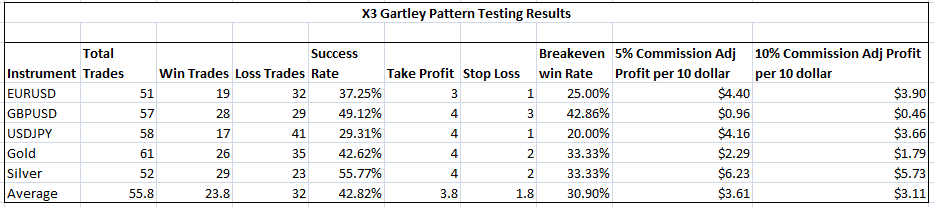
Then this testing results over multiple instruments will be averaged out to provide you the overview of the performance of pattern like below.
| Total Trades | 279 |
| Average Total Trades per Instrument | 55.8 |
| Average Win Trades | 23.8 |
| Average Loss Trades | 32 |
| Average Success Rate | 42.82% |
| Average Take Profit | 3.8 |
| Average Stop Loss | 1.8 |
| Average Breakeven win Rate | 30.90% |
| Average 5% Commission Adj Profit per 10 dollar | $3.61 |
| Average 10% Commission Adj Profit per 10 dollar | $3.11 |
Calculating Statistical Profit per Trader per Account Size
The statistical profit calculation in the above table is tuned for 1000 dollar account with 1% risk (=10 dollar). For example, statistical profit per 1 trade will be 3.11 dollar in above example for 10% Commission case. For 10 trade, the expected profit would be 31.1 dollar. Below are the example calculation to give you some ideas.
- Statistical Profit for 10 trades for 1% risk (=10 dollar) = Average 5% Commission Adj Profit per 10 dollar * 10 = 36.1
- Statistical Profit for 100 trades for 1% risk (=10 dollar) = Average 5% Commission Adj Profit per 10 dollar * 100 = 361.0
or you can use Average 10% Commission Adj Profit per 10 dollar if you want to calculate profit in even tougher case,
- Statistical Profit for 10 trades for 1% risk (=10 dollar) = Average 10% Commission Adj Profit per 10 dollar * 10 = 31.1
- Statistical Profit for 100 trades for 1% risk (=10 dollar) = Average 10% Commission Adj Profit per 10 dollar * 100 = 311.0
If you have different account size of 10,000 dollar with 1% risk (=100 dollar), then your hypothetical profit per 1 trade would be 31.1 dollar and it would 311.00 dollar per 10 trade. If you are using 2% risk, then it would be 622.00 dollar per 10 trade.
- Statistical Profit for 10 trades for 1% risk (=100 dollar) = Average 10% Commission Adj Profit per 10 dollar * 10 * 10 = 311.0
- Statistical Profit for 10 trades for 2% risk (=200 dollar) = Average 10% Commission Adj Profit per 10 dollar * 10 * 100 = 622.0
- Statistical Profit for 100 trades for 2% risk (=200 dollar) = Average 10% Commission Adj Profit per 10 dollar * 10 * 100 = 6220.0
Assuming that you are making 500 trades per year on 10,000 dollar account, then here is your statistical profit calculation per 1 year.
- Statistical Profit for 500 trades for 2% risk (=200 dollar) = Average 10% Commission Adj Profit per 10 dollar * 10 * 500 = 15,550
The insight we get from above equation is that we need quality in our trading and not quantity. However this is hypothetical profit calculation only without considering any secondary confirmation. Therefore, your profit can vary with different market condition and your skill set of using secondary confirmation technique. Highly disciplined trader can achieve the success rate greater than the testing result because they will use the pattern with secondary confirmation technique together. Hence, they will achieve even higher profits than above example calculations. At the same time, poorly disciplined trader could just collapse psychologically by themselves after few runs of trading.
Using Testing Results for Your Trading
Testing results provided here is only statistical and hypothetical reference for your trading. Remember that the main focus of our testing was to compare each pattern apple to apple under the same condition. Traditionally Expert Pattern trader uses Pattern + secondary confirmation in their final decision. In our testing, we do not use any secondary confirmation because technically it is impossible to account for 1000 different secondary confirmations used by different trader. When you use these tested Patterns, please use them with secondary confirmation together as it was directed by many experience trader and analyst in the industry. With good secondary confirmation, you can even achieve higher success rate than the listed testing results.
Testing Result for Day Trader
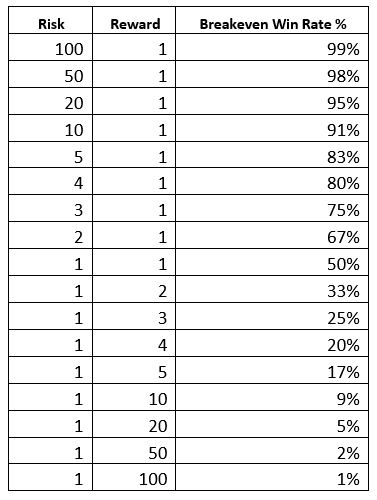
Since we assume that you know the discipline of position sizing, we do provide the testing results where Reward is greater than Risk only. When people say 80% or 90% success rate, that could mean that person never learnt the proper financial trading before. When Reward is greater than Risk, typically your Success Rate will stay well below 80% or 90%. Here is the some guidance for Breakeven Win Rate. You would be profitable as long as you can break this Breakeven Win Rate in the table for your chosen Reward/Risk ratio.
Important Note
The testing results only represents for the Patterns in our products. Product from another company might use pattern with similar look, but their performance can absolutely different from our product performance. Even if the pattern look alike, the pattern detection algorithm can show patterns at totally different time. Please only use this testing results to get the feel of Patterns in our products only but not other company’s products.
Risk Disclaimer
Financial trading carries a high level of risk and is not suitable for all market participants. The leverage associated with trading can result in losses, which may exceed your initial investment. Consider your objectives and level of experience carefully before trading. If necessary, seek advice from a financial adviser.
Related Products


