Probability in Price and Time from Fractal Pattern
Probability in price and time in financial markets refers to the assessment of the likelihood of future price movements within a specific timeframe in the contex of Forex and Stock trading. It involves using various statistical and mathematical tools to analyze historical data, market trends, and other relevant factors to make informed predictions about the direction and magnitude of price changes.
Here are some key concepts related to probability in price and time in financial markets:
- Random Walk Theory: This theory suggests that stock price changes are random and unpredictable. According to this theory, past price movements cannot be used to predict future price movements accurately.
- Probability Distributions: In financial markets, probability distributions such as the normal distribution, log-normal distribution, or others are often used to model the potential outcomes of price movements. These distributions help traders and analysts assess the likelihood of different price levels being reached within a given timeframe.
- Volatility: Volatility measures the degree of variation in the price of a financial instrument over time. Higher volatility implies greater uncertainty about future price movements. Probability calculations often incorporate volatility estimates to gauge the likelihood of price reaching certain levels within a specified time frame.
- Options Pricing: Option pricing models, such as the Black-Scholes model, use probability theory to estimate the likelihood of an option expiring in-the-money or out-of-the-money. These models consider factors such as the underlying asset price, strike price, time to expiration, risk-free interest rate, and volatility to determine the option’s theoretical value.
- Technical Analysis: Technical analysts use various statistical methods, chart patterns, and indicators to assess the probability of future price movements based on historical price and volume data. Common tools include moving averages, support and resistance levels, and momentum indicators.
- Fundamental Analysis: Fundamental analysts evaluate a company’s financial health, industry trends, macroeconomic factors, and other qualitative and quantitative data to estimate the intrinsic value of a security. By assessing the probability of future earnings growth or economic conditions, fundamental analysis can inform investment decisions.
- Event Probability: Traders often assess the likelihood of specific events occurring, such as central bank announcements, corporate earnings reports, or geopolitical developments, and their potential impact on asset prices. This involves understanding market sentiment, interpreting news, and analyzing historical reactions to similar events.
- Risk Management: Probability analysis is crucial for effective risk management in financial markets. Traders and investors use probability calculations to determine position sizing, set stop-loss levels, and establish risk-reward ratios to protect against adverse price movements.
Overall, probability in price and time plays a vital role in guiding investment decisions, managing risk, and understanding market dynamics in financial markets. However, it’s essential to recognize that while probability analysis can provide valuable insights, it cannot eliminate all uncertainties associated with market fluctuations.
Probability of price and time in Forex and Stock trading is the advanced information that can be used to determine a buy or sell position for your day trading. However, to understand how the probability of price and time in Forex and Stock market is structured, you need to understand the underlying dynamics in price and time as well as the crowd psychology around the financial market. Let us cover some of these aspects in in this article to improve your trading performance.
If the price data in forex and stock market possess the deterministic cycle, the algorithm like Fourier transformation, Wavelet transformation or Singular Spectrum Analysis could provide us the wavelength and amplitude of the specific cycle we want to trade. This could make our trading much easier and profitable. However, forex and stock market are affected by too many internal and external variables. The market are rather impulsive and fuzzy. In another words, the amplitude and wavelength of a cycle can not be guaranteed. Therefore, the deterministic cycle approach might be not the viable option for the choice of trading strategy.
Fractal wave in the price data possess the statistical self-similarity. This is close to the stochastic cycle rather than the deterministic cycle. In the stochastic cycle, the wavelength and amplitude of a cycle are not fixed but they can vary.The peak trough transformation introduced in this book is the effective method to extract the stochastic cycle in the financial market. In another words, we can measure the probability of a cycle after the price data is transformed to the peaks and troughs. Although we are likely to have the triangular fractal wave, this is hardly not a problem. We can still calculate the probability of the wavelength and amplitude of the specific cycle.
In real world, the price data will show complex structure, which the triangular fractal wave is combined with some trends. Hence, they are not stationary. We have shown the combined data structure of the fractal wave and a trend in the fifth column of the price pattern table. We can predict when a peak or trough will arrive in the price data with a probability. This was referred to as the turning point probability in the book: Predicting Forex and Stock Market with Fractal Pattern (Young Ho Seo, 2020). For example, when price is moving up from the trough, we can make the prediction when the peak will arrive by measuring the change in price and time. In another words, we can predict the position of swing high from the previous swing low in the statistical sense.
Likewise, when price is moving down from the peak, we can make the prediction when the trough will arrive by measuring the change in price and time. In another words, we can predict the position of swing low from the previous swing high in the statistical sense. This turning point probability is the statistical prediction made after the peak trough transformation of the price data. Since there are multiple of fractal wave cycles in the price data, we can calculate the turning point probability for each fractal wave cycle. In the book: Predicting Forex and Stock Market with Fractal Pattern (Young Ho Seo, 2020), the technique was referred to as the Fractal Cycle Analysis or FCA. Just like the Fourier transformation, Wavelet transformation or Singular Spectrum Analysis provide the analysis over multiple deterministic cycles, Fractal Cycle Analysis provides the analysis over multiple stochastic cycles. Fractal Cycle Analysis is the good technique to use when the deterministic cycle analysis is not applicable to the data.
Fractal Pattern Indicator is the first tool that helps you to measure the probability of turning point in price and time. In another words, you can predict the turning point using Fractal pattern indicator. Probability is good because it is measurable and quantifiable for your trading. We added some description of this probability in our product page below. However, it might be better to have some more explanation on this.
https://www.mql5.com/en/market/product/49170
https://www.mql5.com/en/market/product/49169
https://algotrading-investment.com/portfolio-item/fractal-pattern-scanner/
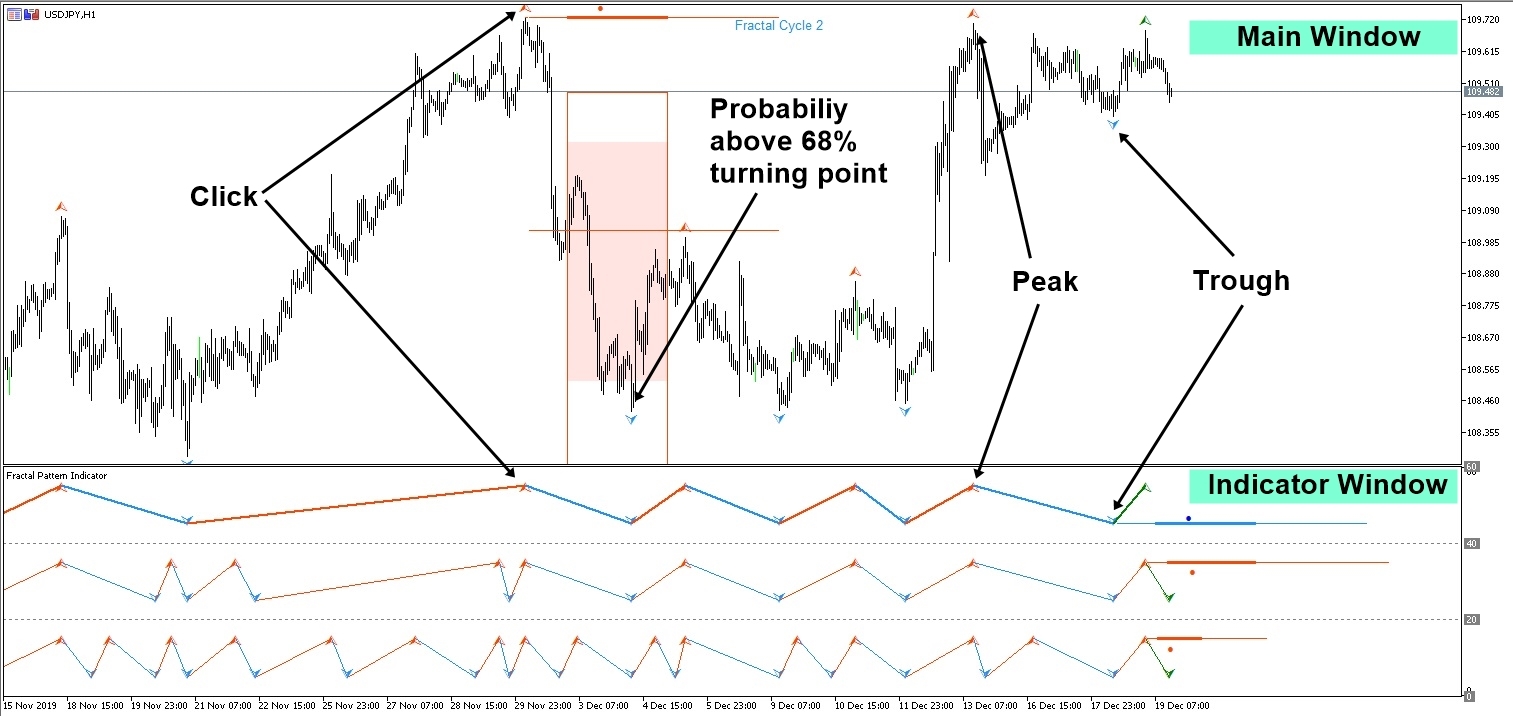
In fact, you can access this probability information from both main window and indicator window as it is shown in the screenshot below. As you can see, the advantage of Fractal pattern indicator is that you have an access to three different Fractal cycles including small, medium and large. You have instant access to all the probability information of these cycles.
Once the probability information is laid out, you can tell how mature the current trend is in price and time. Hence, you can predict the next turning point.
Related Products


