Trading Signal with Turning Point Probability
In this article, we will explain how to use the trading signal obtained with Turning Point Probability as the technical analysis in Forex and Stock Trading. This turning point probability is the statistical prediction made after the peak trough transformation of the price data. Since there are multiple of fractal wave cycles in the price data, we can calculate the turning point probability for each fractal wave cycle. In the book: Predicting Forex and Stock Market with Fractal Pattern (Young Ho Seo, 2020), the technique was referred to as the Fractal Cycle Analysis or FCA. Just like the Fourier transformation, Wavelet transformation or Singular Spectrum Analysis provide the analysis over multiple deterministic cycles, Fractal Cycle Analysis provides the analysis over multiple stochastic cycles. Fractal Cycle Analysis is the good technique to use when the deterministic cycle analysis is not applicable to the data.
To present the turning point probability in Forex and Stock Market, we have devised the simple turning point probability graph. When we predict the peak, in the probability graph, Y axis (=the left axis) indicates the turning point probability in price dimension and X axis (= the bottom axis) indicates the turning point probability in time dimension. The probability ranges from 0.0 (=0%) to 1.0 (=100%). Typically, there is no practical application making use of 100% probability in the world. Since our calculation is based on the price data only (i.e. empirical probability), we recommend using 90% probability or less for the maximum probability. For example, even if the price stays above the 90% probability, it is better to treat them as 90% or less depending on how conservative your trading style is.
To help with practical trading, we can provide the Fibonacci retracement ratio in the same graph. Hence, we can use top axis and right axis to respectively represent the Fibonacci retracement in time and price. The way it works is nearly identical to the Fibonacci ratio analysis. Although many trading strategy are based on Fibonacci ratio analysis in price only, the Fibonacci Probability graph provides the additional Fibonacci ratio analysis in time dimension too.
On the right axis, we can place some important Fibonacci retracement ratio in price including 38.2%, 50%, 61.8% and so on. All the ratios are calculated with the absolute value of price height. The formula to calculate the Fibonacci retracement ratio is like below.
Fibonacci retracement ratio in price = Right swing of fractal triangle (Y0) / Left swing of fractal triangle (Y1)
Likewise, the top axis provides the Fibonacci retracement ratio measured in time dimension. All the ratios are calculated with the absolute value of time width. We use the identical formula to calculate the ratio as below:
Fibonacci retracement ratio in time = Right swing of fractal triangle (X0) / Left swing of fractal triangle (X1)
The graph with the four axes of probability and Fibonacci retracement ratio is called Fibonacci Probability graph. The Fibonacci Probability graph is a simple but powerful tool to predict the arrival of the turning point within a specific fractal wave cycle.
To predict the turning point more accurately, we need to observe more than one fractal cycle. To do that, we can use a stacked bar graph to represent the turning point probability of each cycle. For example, we can draw the turning point probability for small cycle on the bottom of the graph and we can draw the turning point probability for large cycle above. When we stack up the bar graph for several cycles, we could have the nice overview of the turning point probability for multiple cycles. Of course, it is possible to stack up more than two bar graphs sharing the same time axis.
When the turning point probability is high, we can expect the turning point to arrive within the fractal cycle. Like the margin of safety described by Benjamin Graham, it is safe to use the turning point probability in conservative manner. We should only look for the turning point within the higher probability area. The margin of safety will tell that higher turning point probability is safer to predict the turning point. On the other hand, we can look for the breakout opportunity or we can expect the price to move in the same direction within the lower turning point probability area. We can consider the trend probability providing the opposite concept of the turning point probability. In a simple math, we can derive the trend probability by subtracting the turning point probability from one like “1.0 – the turning point probability”. Or if you prefer the percent, we can derive the trend probability by subtracting the turning point probability (%) from one hundred percent like “100% – turning point probability (%)”. Since the turning point probability is drawn from the peak trough transformation directly, the conversion of the trend probability from the turning point probability should be taken as the rule of thumb guideline for your trading. As in the turning point probability, the margin of safety will tell that higher trend probability is safer to predict the breakout or price continuation.
From the simple math for the trend probability (= 1.0 – the turning point probability), we can tell that high turning point probability is equal to the low trend probability. Likewise, we can tell that low turning point probability is equal to the high trend probability. For the first example, say that the price is moving down from the last peak. If the turning point probability is less than 50%, there is a high chance that price will continue to fall. It can be confirmed because the trend probability is greater than 50% (=100% – 50%). The chance that price will continue to fall is even higher if the turning point probability is less than 30%. It can be confirmed because the trend probability is greater than 70% (=100% – 30%). If we need to predict the breakout or price continuation, then it would be safer to choose the trend probability 70% or over in this example.
For the second example, say that the price is moving up from the last trough. If the turning point probability is less than 50%, there is a high chance that price will continue to rise. It can be confirmed because the trend probability is greater than 50% (=100% – 50%). The chance that price will continue to rise is even higher if the turning point probability is less than 30%. It can be confirmed because the trend probability is greater than 70% (=100% – 30%). If we need to predict the breakout or price continuation, it would be safer to choose the trend probability 70% or over in this example. These examples are purely based on the interpretation of the probability alone. However, the usage of the turning point probability or the trend probability can be extended with other price pattern analysis. At the most basic level, you could use the given Fibonacci retracement level together with the turning point probability. In the next chapter, we will discuss some other ways to combine the turning point probability with other price patterns.
Fractal Pattern Scanner provides the turning point probability in time and price. It provides unique trading opportunity that typical trading strategy does not offer. Most of trading strategy does not concern time factor. But we do in the Fractal Pattern Scanner.
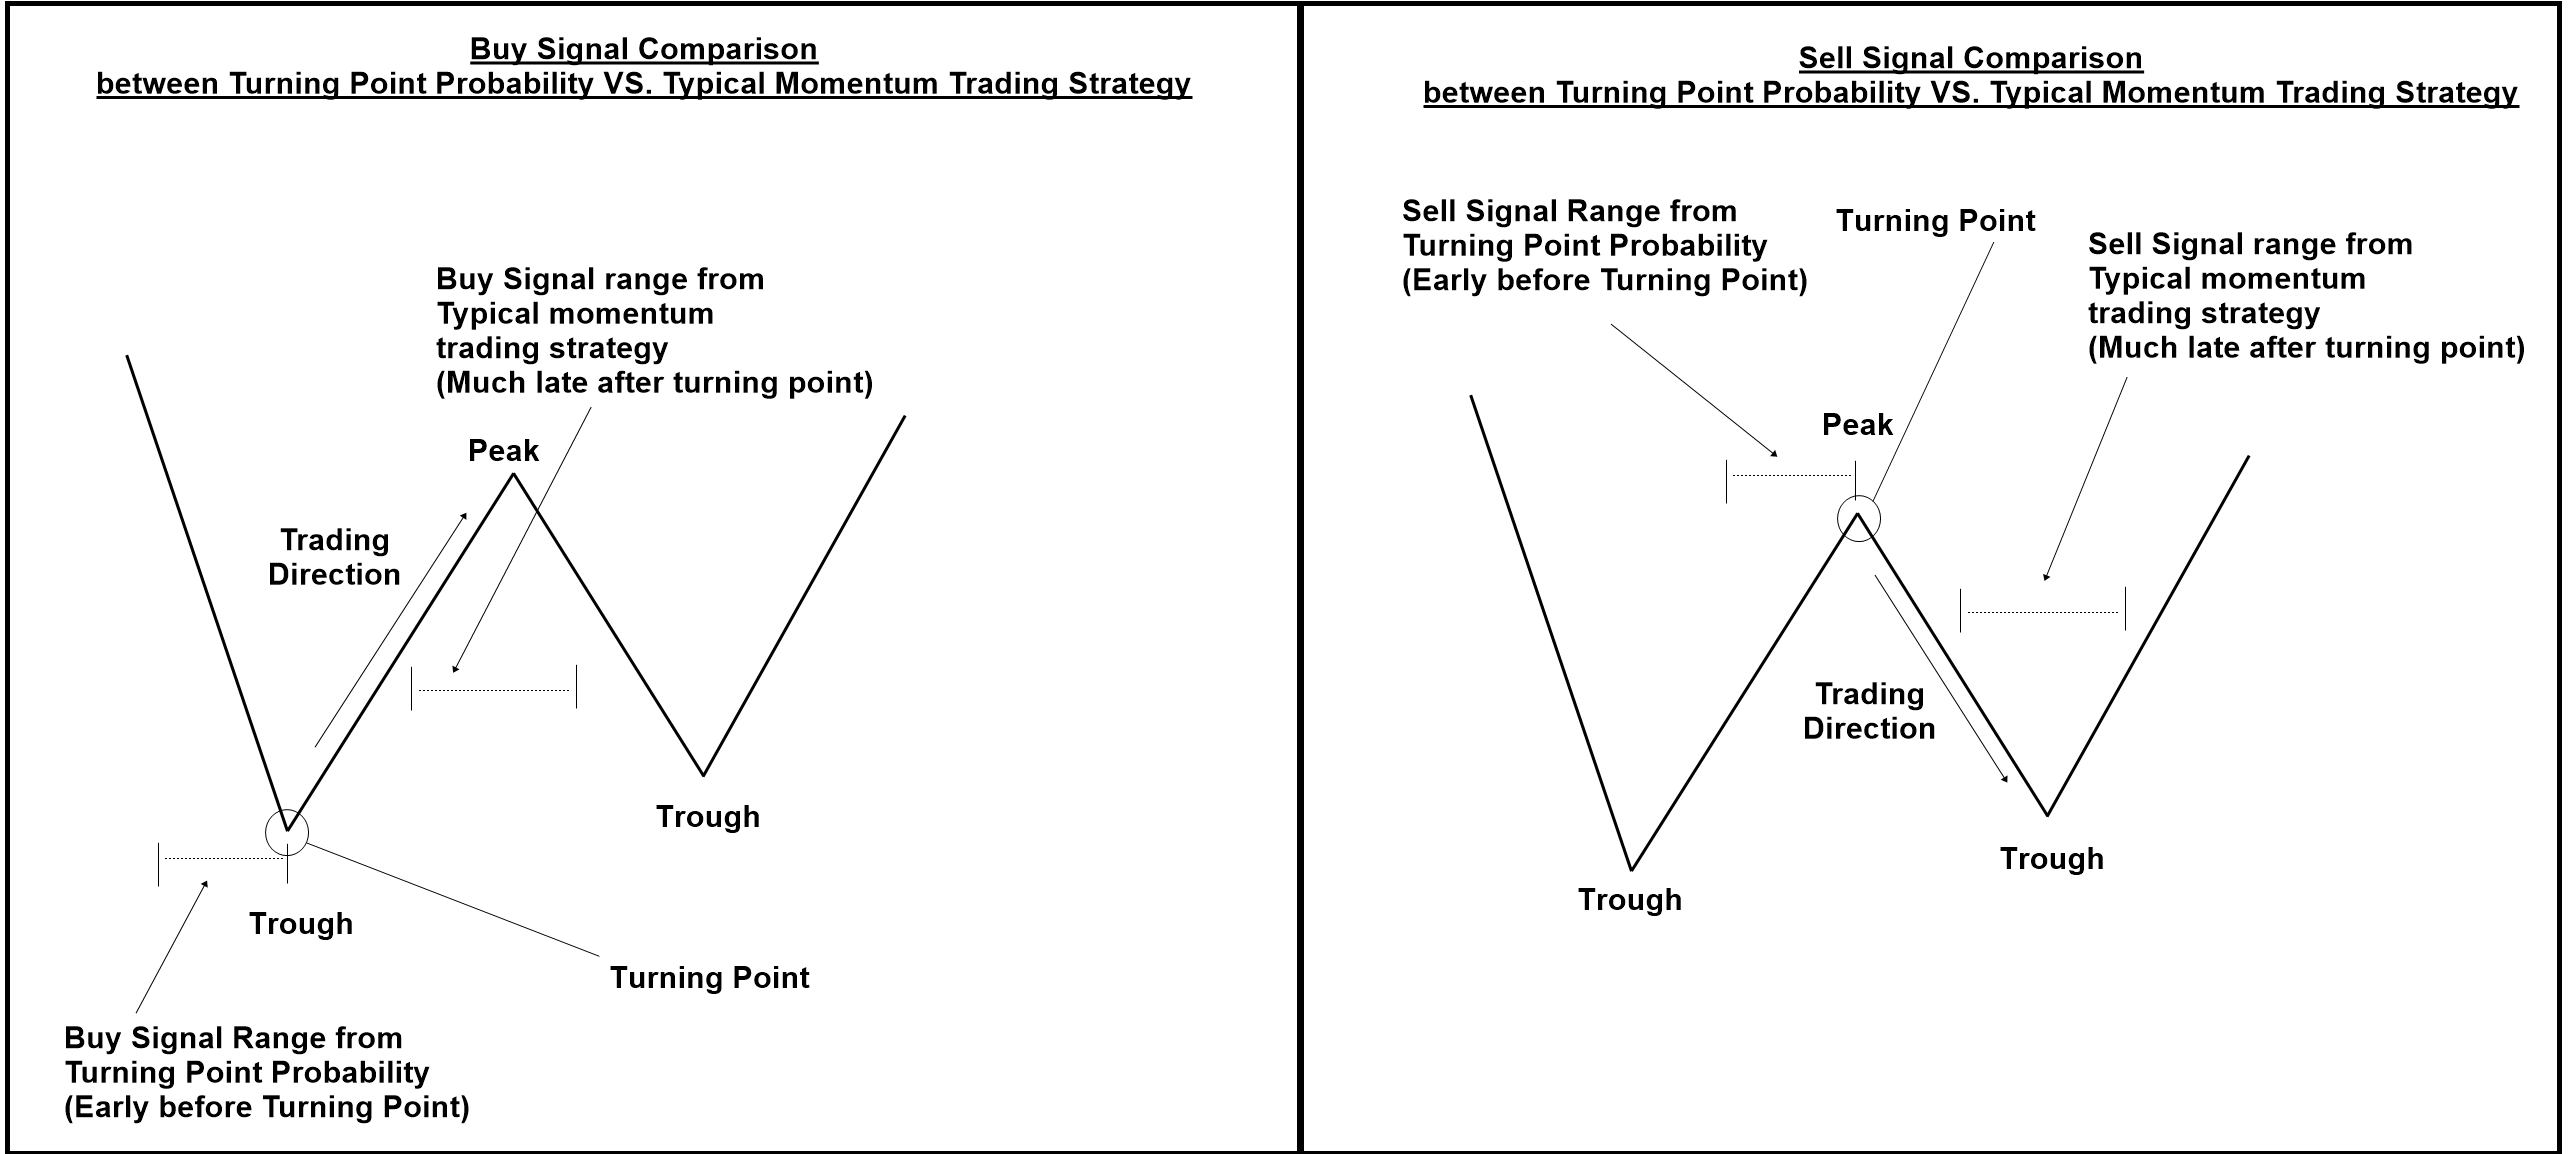
To help your trading with Fractal Pattern Scanner, here is the brief comparison of trading signal between turning point probability and typical momentum trading strategy.
The key difference between turning point probability and typical momentum trading strategy is in their timing. Turning point probability will provide much early warning before the arrival of the actual turning point (= birth of new trend). Typically momentum strategy will provide much late warning after the turning point.
With turning point probability, you can be ready before arrival of turning point. That is really important advantage for your trading. With this advantage, you should try to enter as near as the turning point. At the same time, you should make efforts to catch the momentum phase of trend, which is coming after turning point.
Hence, we provide both Fractal Moving Average Indicator + Fibonacci Probability Grid in price and time as an additional set of tools you can use in your trading.
You can also check the attached diagram to support your understanding on the advantage of turning point signal.
For your information, knowledge of Harmonic Pattern, Elliott Wave Pattern and X3 patterns are the added skills in your trading with turning point.
Here is the landing page to our Fractal Pattern Scanner (Paid Indicator)
https://www.mql5.com/en/market/product/49170
https://www.mql5.com/en/market/product/49169
https://algotrading-investment.com/portfolio-item/fractal-pattern-scanner/
Here is the landing page to our Fractal Moving Average Indicator (Free for everyone with some limitation for free users.)
https://www.mql5.com/en/market/product/46277
https://www.mql5.com/en/market/product/46276
https://algotrading-investment.com/portfolio-item/fractal-moving-average-indicator/
Related Products


