Harmonic Pattern, Elliott Wave Pattern and X3 Pattern with Turning Point Probability
Turning Point Probability (TPP) is a concept used in technical analysis to assess the likelihood of a price reversal at a certain point in a financial market, which can be used with Harmonic Pattern, Elliott Wave pattern, and X3 pattern. It’s often utilized in conjunction with various patterns like Harmonic Patterns, Elliott Wave Patterns, and X3 Patterns to identify potential turning points in price movements.
- Harmonic Patterns: Harmonic patterns are geometric price patterns that use Fibonacci ratios to identify potential reversal points in the market. Common harmonic patterns include the Gartley, Butterfly, Bat, and Crab patterns. Turning Point Probability in harmonic patterns involves analyzing key Fibonacci retracement levels, confluence zones, and the symmetry of the pattern to gauge the likelihood of a price reversal occurring at those levels.
- Elliott Wave Patterns: Elliott Wave Theory proposes that market price movements follow a repetitive pattern of waves, consisting of impulse waves (trending) and corrective waves (counter-trend). By identifying these waves, traders can anticipate potential turning points in the market. Turning Point Probability in Elliott Wave Patterns involves assessing wave counts, Fibonacci retracement levels, and wave relationships to determine the probability of a reversal occurring at specific wave targets.
- X3 Patterns: X3 Patterns are a type of pattern recognition methodology that seeks to identify potential reversal points based on the alignment of multiple technical factors. These factors may include price action, volume, momentum indicators, and pattern formations. Turning Point Probability in X3 Patterns combines the analysis of these multiple factors to determine the likelihood of a price reversal occurring at a particular point in the market.
In all these pattern-based approaches, traders use historical price data, technical indicators, and pattern recognition techniques to identify potential turning points in the market and assess the probability of a reversal occurring. However, it’s important to note that no method can guarantee the future direction of prices with certainty, and traders often use risk management strategies to mitigate potential losses.
In this article, we will explain how to combine Harmonic Pattern, Elliott Wave Pattern and X3 Pattern with Turning Point Probability in Forex and Stock market. Before we explain this, you need to understand that Harmonic Pattern, Elliott Wave Pattern and X3 Pattern are all heavily related to Fractal Wave as well as turning point probability. Hence, when we talk about we combine Harmonic Pattern, Elliott Wave Pattern and X3 Pattern with Turning Point Probability, we means to use the “pattern inside pattern” analysis (PPA) to reinforce our buy and sell trading decision. The Pattern inside pattern analysis was convered as the third important characteristic of Fractal Wave in the book: Science Of Support, Resistance, Fibonacci Analysis, Harmonic Pattern, Elliott Wave and X3 Chart Pattern. Let us just cover what is the third importnat characteristic of Fractal Wave.
The third important characteristic is “pattern inside pattern”. We already know that small patterns make up the bigger pattern in fractal. When we trade, sometimes, we have to see both small pattern and bigger pattern together. Especially, more advanced pattern analysis like Harmonic Pattern, Elliott Wave Theory and X3 Chart Pattern often involve “pattern inside pattern” analysis (PPA). When we compare cycle and fractal wave in analogy, this becomes obvious. For example, let us assume that the price is cyclic, just to help your understanding. Let us assume that the price shows one large cycle and one small cycle. With these two cycles, the best buy entry can be calculated when the sum of both cycles provide the lowest price. The turning point like this is the entry where we can maximize our profit with the lowest risk. “Pattern inside pattern” analysis (PPA) is the similar technique to find the optimal entry in the financial market data, where fractal wave is dominating instead of the cycles.
If the above cycle example is still not clear, then let us introduce another simpler example to explain why “pattern inside pattern” analysis (PPA) is necessary. For example, say that there are two rivers with different size. If the two rivers join to create a bigger river, the river will push our boat with greater force too. Like this, in trading, it is advantageous to find the entry, where the joint force between two waves can create a positive synergy. This is the reason why we have to watch out the pattern inside pattern.
Fractal Pattern Scanner provides unique and powerful insight for the turning point prediction. Therefore, it could be good supplementary tool to confirm Harmonic Pattern, Elliott Wave Pattern and X3 pattern in your trading.
As we have mentioned, the structure of Harmonic Patterns, Elliott Wave patterns and X3 patterns are made up from Retracement and Expansion Ratio. We have already covered this in details in these two articles.
https://algotrading-investment.com/2019/07/09/defining-profitable-patterns/
Now, when you think about the structure of these patterns, they use the relative part of the prediction equation. It is because the retracement and expansion ratio are calculated by comparing the size of current wave and previous wave. Hence, they are relative only.
These patterns are good predictor of turning point. However, they still miss the absolute part of the prediction equation. We know that any good prediction would combine both relative and absolute terms. They are often considered as the best prediction.
Turning Point Probability provided from Fractal Pattern Scanner is the absolute term because Probability is universal across entire data. They are not different per each wave. Hence, if you want to advance your trading, combining Fractal Pattern Indicator with Harmonic Pattern, Elliott Wave patterns and X3 patterns are the good approach.
At least, we can propose two methods to combine the Fractal Pattern indicator with Harmonic Pattern, Elliott Wave pattern and X3 pattern. We provide these two methods because these methods are simple and intuitive. However, this is not the exhausted list. You can always develop more sophisticated approach once you have mastered the basic methods. The two approaches include:
Method 1. Combining Patterns with Turning Point Probability
Method 2. Combing Patterns with Mother Wave detection
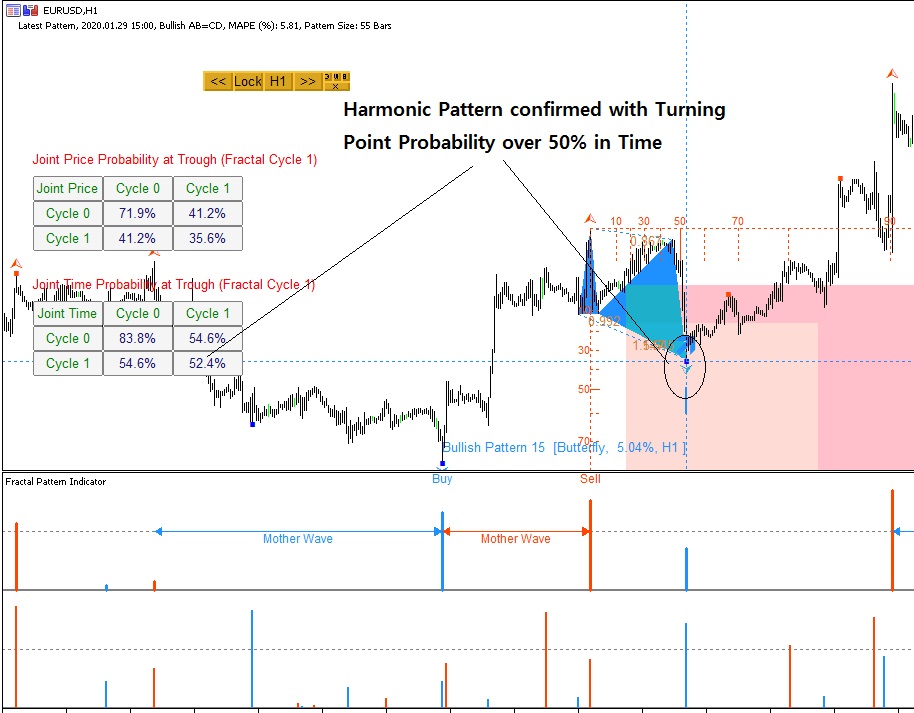
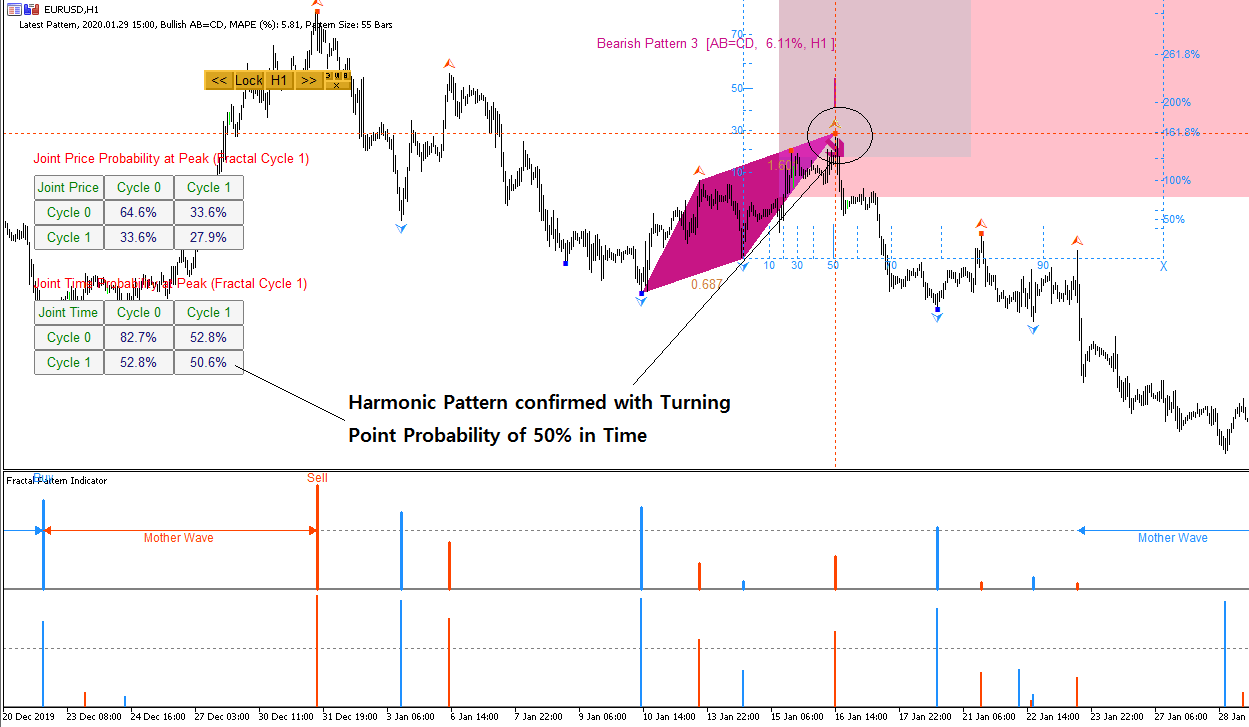
In method 1, you can simply combine Harmonic Pattern, Elliott Wave Pattern and X3 Patterns with Turning Point Probability at any Fractal Cycles. In this method, you will combine at least one Probability or two to confirm the appearance of Harmonic Pattern, Elliott Wave Pattern and X3 Patterns. Especially, we recommend you to watch the turning point probability in time. Because these patterns are detected by measuring the price movement only, the turning point of time can provide you the fresh information to confirm your patterns.
Typically, we recommend to filter bad patterns if the current turning point provides probability less than 50% in time. For example, this screenshot below show the final D point of Harmonic Pattern coincided with the turning point probability of 52.4% in time. This can be checked in both Joint Probability Matrix and Probability – Fibonacci Grid in the Fractal Pattern Indicator. We provide the example for both bearish and bullish Harmonic Patterns in the screenshot below. It is always better to bet your money with the probability that is greater than 50%. If you want to provide more tighter criteria for your trading, it is possible that you set minimum turning point probability between 60 – 80% in time. However, this might provide you fewer Harmonic Patterns to trade. Whether you want to add turning point probability in price, this is an optional criteria only.
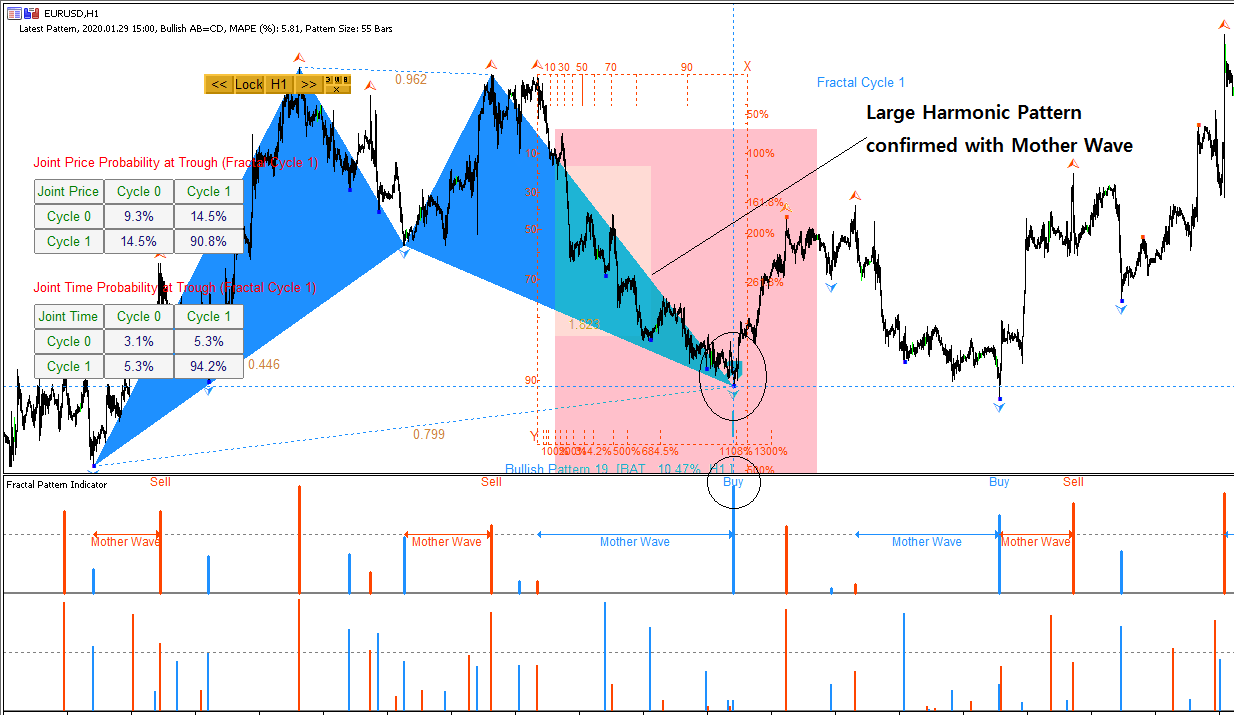
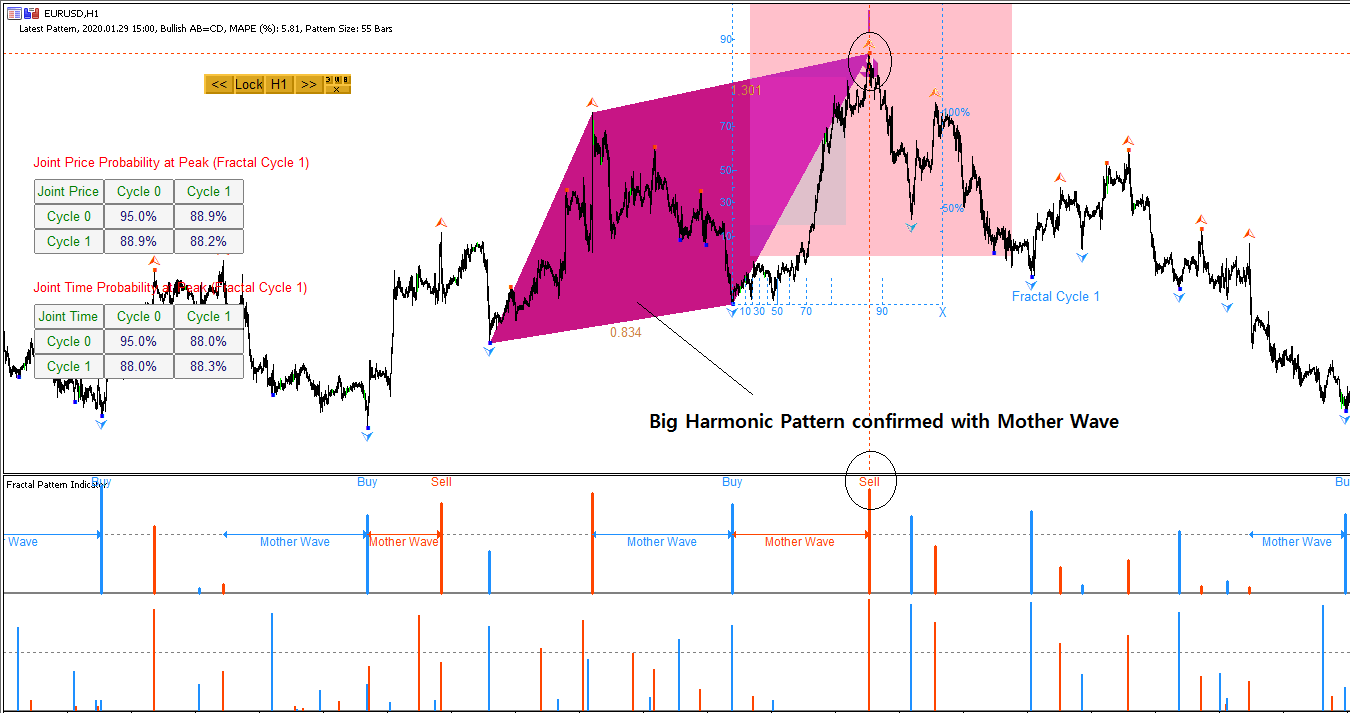
Another method is to confirm the Harmonic Pattern, Elliott Wave Pattern and X3 pattern is doing it with mother wave detection. Mother wave is the bigger wave nesting child waves inside. Its trading concept is similar to Elliott Wave. However, Mother wave detection is based on statistical probability, which is the absolute part of prediction equation, whereas Elliott Wave pattern is based on the relative part of prediction equation, that is retracement and expansion. Detection of Mother wave typically predicts the change in the market direction for the big price movement.
We have provided the article on how to set Mother Wave Detection in the Fractal Pattern Indicator. Below is the link for the article:
https://algotrading-investment.com/2020/02/20/mother-wave-detection-setting/
When you want to trade Harmonic pattern, Elliott Wave pattern and X3 pattern together with Mother Wave, then you need to lower down the criteria for Mother Wave detection.
For example, if you set Mother wave detection like this:
- Mother Wave Price Probability: 0.95 (95%)
- Mother Wave Time Probability: 0.70 (70%)
- Child Wave Price Probability: 0.0 (0%)
- Child Wave Time Probability: 0.0 (0%)
You have only few patterns that can be confirmed with Mother wave. Hence, I recommend to lower down the criteria.
You can fiddle around with Mother wave setting in your Fractal Pattern Indicator. However, you might start with these probability first.
- Mother Wave Price Probability: 0.60 (60%)
- Mother Wave Time Probability: 0.60 (60%)
- Child Wave Price Probability: 0.0 (0%)
- Child Wave Time Probability: 0.0 (0%)
Another important consideration to combine mother wave with Harmonic patterns, Elliott Wave patterns and X3 patterns is the pattern size. Mother wave typically involves the big price movement. Hence, it is better if the bigger Harmonic Pattern, Elliott Wave Pattern and X3 patterns are confirmed with mother wave. As you can see from the screenshot below, mother wave detection often coincide with big harmonic patterns.
We hope that this article provides some insight on how to combine these popular Harmonic Pattern, Elliott Wave patterns and X3 patterns together with Fractal Pattern Scanner. Here is the landing page to our Fractal Pattern Scanner (Paid Indicator)
https://www.mql5.com/en/market/product/49170
https://www.mql5.com/en/market/product/49169
https://algotrading-investment.com/portfolio-item/fractal-pattern-scanner/
Do not forget that we provide Fractal Moving Average Indicator for free of charge as an additional supporting tool for your trading.
Here is the landing page to our Fractal Moving Average Indicator (Free for everyone with some limitation for free users.)
https://www.mql5.com/en/market/product/46277
https://www.mql5.com/en/market/product/46276
https://algotrading-investment.com/portfolio-item/fractal-moving-average-indicator/
Related Products


