Falling Wedge Pattern and Rising Wedge Pattern with Turning Point Probability
In this chapter, we will show you how to combine statistical regularity and geometric regularity to trade with Wedge patterns. In Wedge patterns, the geometric regularity is recognized with the envelope triangle that encompasses the several fractal triangles inside with gradually contracting amplitudes (Figure 4.6-1). This often indicates the decreasing volatility in the market. Trader often anticipates the explosive price movement after the decreasing volatility. Hence, trader tends to use the Wedge patterns for breakout trading. There are two different cases to trade with Wedge patterns. Firstly, the current price can be inside these patterns. Secondly, the current price can be outside these patterns with some distance. The trading tactics involved in these two cases are different. Hence, we will explain them one by one.
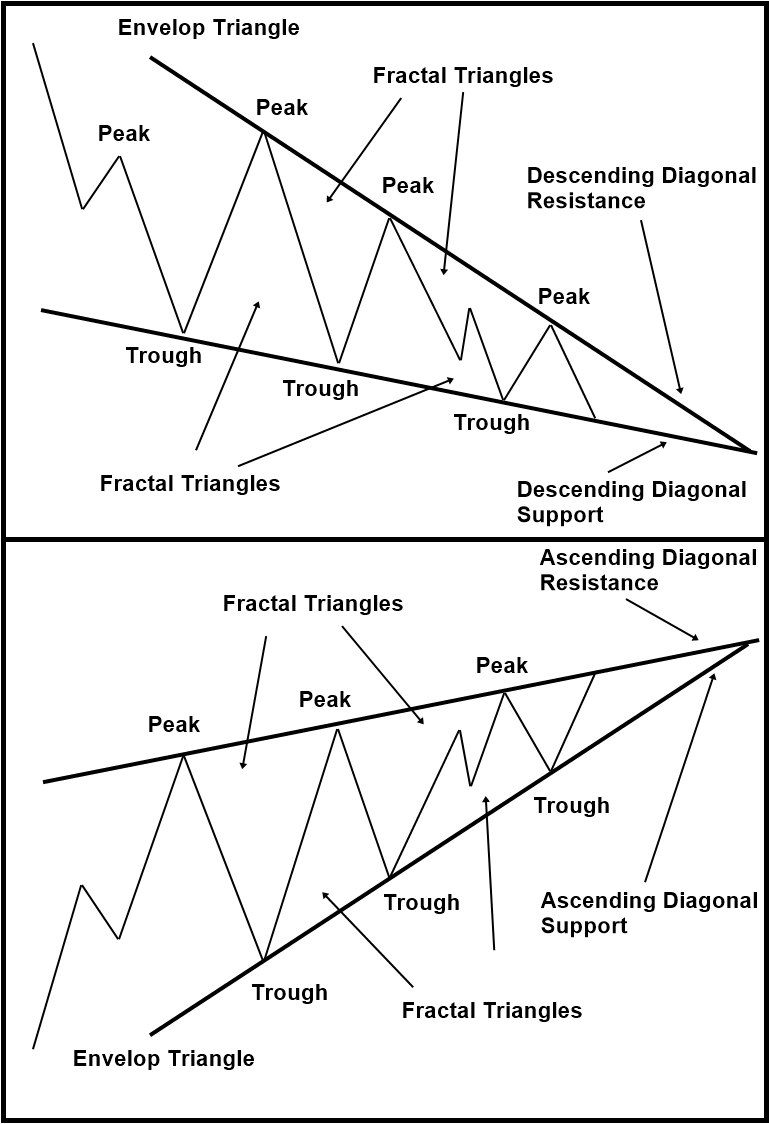
Figure 4.6-1: Conceptual drawing of Falling Wedge and Rising Wedge Pattern
Firstly, let us start with the case in which the current price stays inside these Wedge patterns. In this case, we would expect to use the outline of the wedge pattern as the breakout trading. Figure 4.6-2 shows the Falling Wedge pattern with the current price inside the pattern. To trade with breakout more accurately, we need to apply statistical regularity.
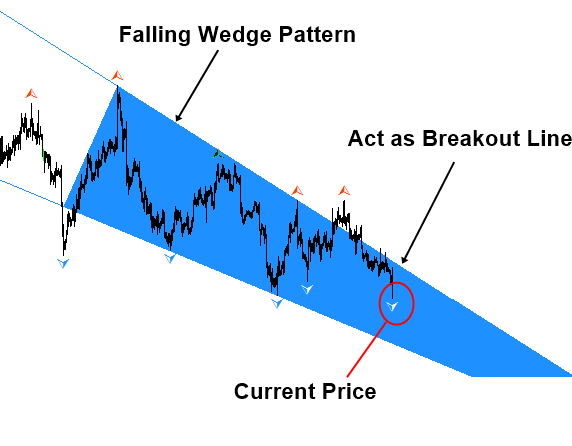
Figure 4.6-2: Falling Wedge pattern detected in EURUSD H4 timeframe
Firstly, we need to make sure that current trough is confirmed with sufficiently high probability. In this example, we can see that the trough has 82% probability in time dimension (Figure 4.6-3). This means that the price run in the same direction for the prolonged period. This gives us the clue for the turning point at this trough. If we do not confirm this, price can go down more probably. Hence, we have to wait longer for our breakout trading.
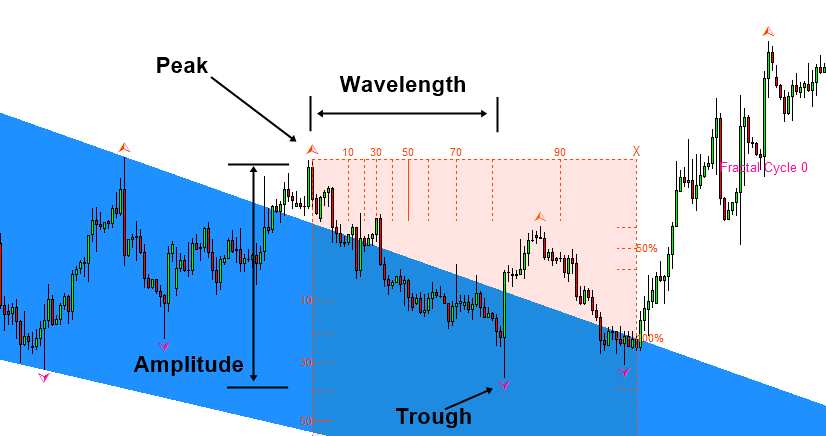
Figure 4.6-3: Falling Wedge pattern detected in EURUSD H4 timeframe
Once the trough is confirmed, then next thing we need to check is the distance between the trough and the breakout point. If we want to take the proactive action, we might have to guess the potential breakout point to measure the distance. If you can wait to see the actual breakout, then you can just measure the distance between actual breakout point and the trough (Figure 4.6-4). From the measured distance, we are looking for the fresh and young price movement. For example, we are looking for low probability at the breakout point. We need to make sure that there is a low chance that price will reverse because we are looking for breakout.
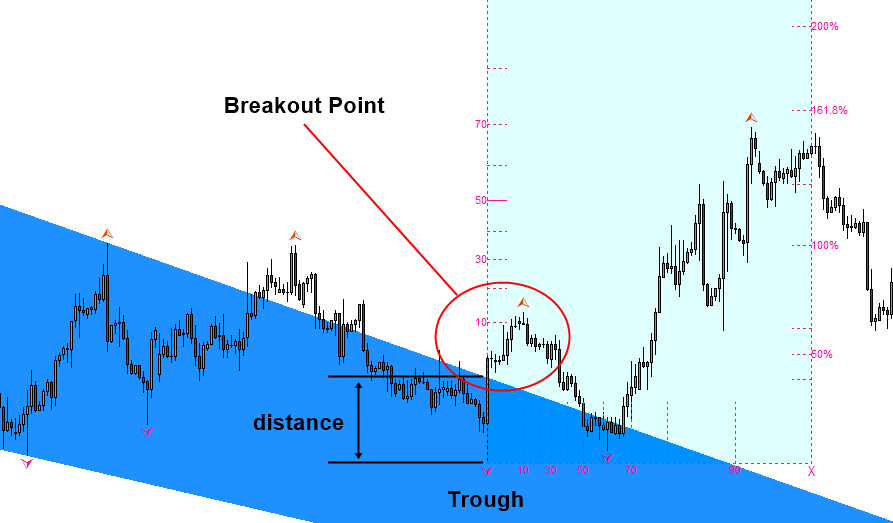
Figure 4.6-4: Falling Wedge pattern detected in EURUSD H4 timeframe
Summary for breakout trading by combining geometric regularity and statistical regularity for Falling Wedge pattern is like below:
- Detect descending diagonal support and resistance with gradually decreasing volatility (Figure 4.6-1).
- Check if the price is inside the Falling Wedge pattern.
- Check if the latest trough provides the sufficient turning point probability either in price dimension or in time dimension.
- Measure the distance between the breakout point and the trough. Make sure that the chance for reversal is low at the breakout point on the Falling Wedge pattern.
Now consider the example of rising wedge pattern. The trading logic is the same as before. Firstly, we will recognizing the Rising Wedge pattern by detecting ascending support and resistance with the gradually decreasing volatility. Then make sure that current price is inside the rising wedge pattern.
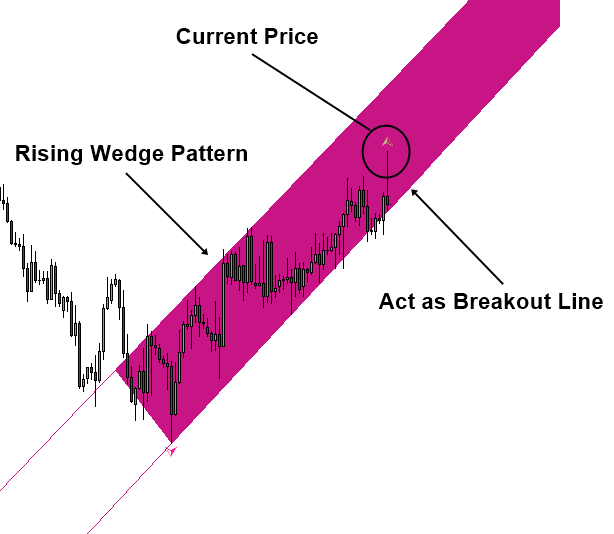
Figure 4.6-5: Falling Wedge pattern detected in EURUSD H4 timeframe
Next, we need to check some evidence to confirm the validity of current peak. For example, we need to make sure that latest peak provide sufficiently high chance for the turning point. We can check this using the turning point probability either in price dimension or in time dimension (Figure 4.6-6).
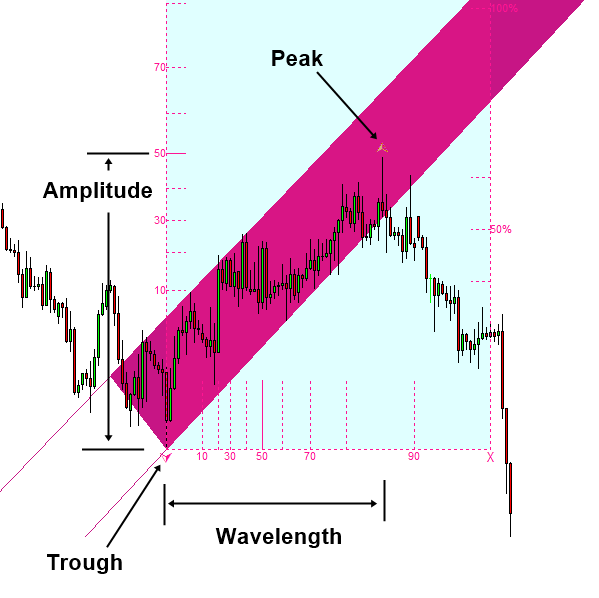
Figure 4.6-6: Falling Wedge pattern detected in EURUSD H4 timeframe
Next, we will measure the distance between breakout point and the latest peak. We need to make sure that the price movement at breakout point is fresh and young. Therefore, they can penetrate the bottom of the rising wedge pattern with higher power. The point is that the breakout point on the Rising Wedge pattern should not provide any potential for reversal because we are looking for breakout.
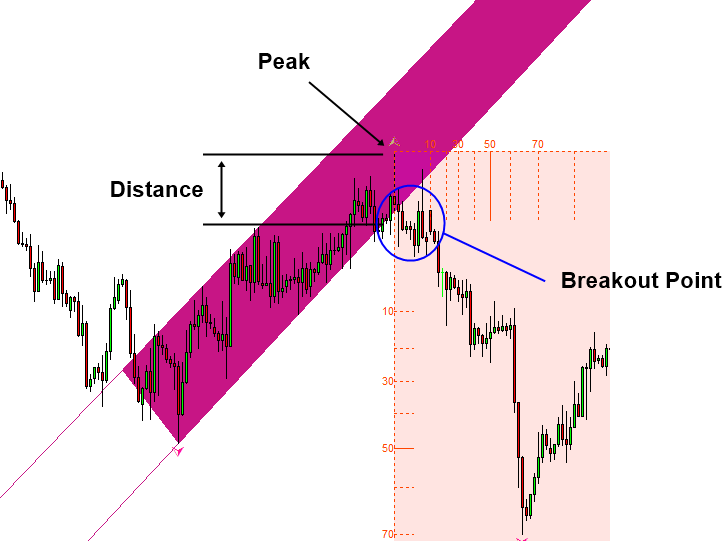
Figure 4.6-7: Falling Wedge pattern detected in EURUSD H4 timeframe
Summary for breakout trading by combining geometric regularity and statistical regularity for the Rising Wedge pattern is like below:
- Detect ascending diagonal support and resistance with gradually decreasing volatility (Figure 4.6-1).
- Check if the price is inside the rising wedge pattern.
- Check if the latest peak provides the sufficient turning point probability either in price dimension or in time dimension.
- Measure the distance between the breakout point and the peak. Make sure that the chance for reversal is low at the bottom of rising wedge pattern.
After you understood the examples for the Falling Wedge and Rising wedge patterns, you can tell that trading with Wedge patterns is nearly identical to turning point trading as in Support, Resistance, and Harmonic Pattern Trading. Now we will show you some bad example of breakout trading to aid your understanding. Figure 4.6-8 shows the Rising Wedge pattern with such an example. Many trader could anticipate the breakout when they detect the highest peak inside the Rising Wedge pattern. However, the distance between the breakout point and the peak nearly spans 90% probability in price dimension. As you can see, price can make the reversal rather than breakout. This is why we are looking for fresh and young movement at breakout.
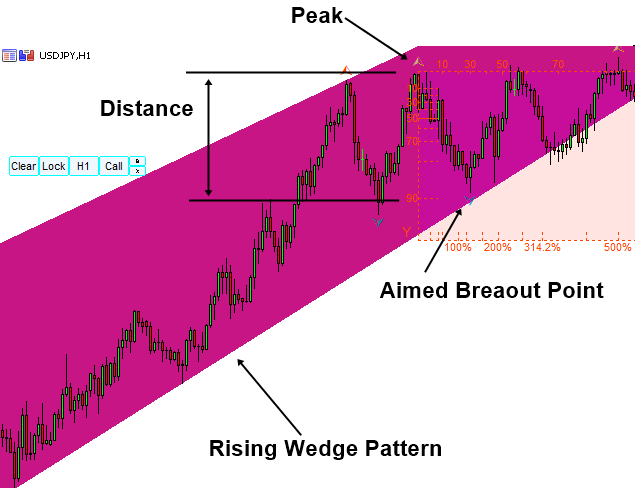
Figure 4.6-8: Rising Wedge pattern detected in USDJPY H1 timeframe
There is a case that you believe that there is a chance for breakout no matter what. Although the distance to breakout is not too small, you might not want to miss the opportunity to trade. In this case, we will advise you to miss the first breakout on the Wedge pattern. However, you can make the entry at the second breakout point assuming the price is not moving inside the wedge pattern again. We know that when volatility runs out, price is likely to reverse. Hence, we do not have to rush for the first breakout point. It is better to wait the volatility to backup. Then we take the second breakout point as the safer entry. In doing so, the outline of the wedge pattern must support the price as shown in Figure 4.6-9.
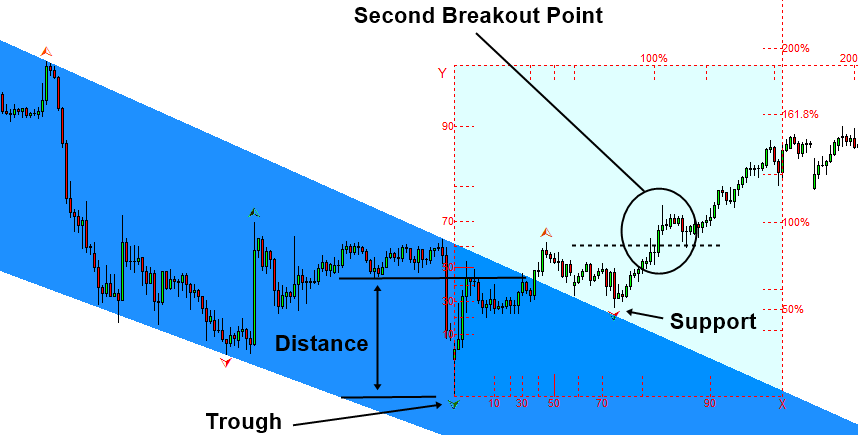
Figure 4.6-9: Falling Wedge pattern detected in USDJPY H4 timeframe
So far, we have demonstrated the trading logic for Falling Wedge pattern and Rising Wedge pattern when the price is inside the pattern. However, some people use Wedge patterns when the price is outside them too. In this case, the trading strategy is more less the same with support and resistance trading. For example, the outline of wedge pattern will act as support and resistance. In fact, the outlines of Wedge patterns are just diagonal support and resistance as shown in Figure 4.6-1. For example, Figure 4.6-10 and Figure 4.6-11 shows the case when the Falling Wedge and Rising Wedge patterns act as support and resistance.
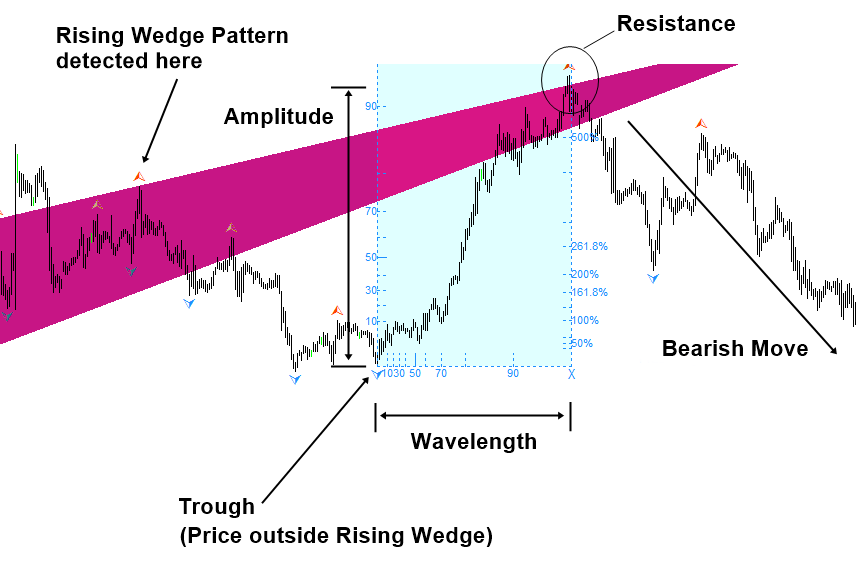
Figure 4.6-10: Rising Wedge pattern act as the resistance in EURUSD H1 timeframe
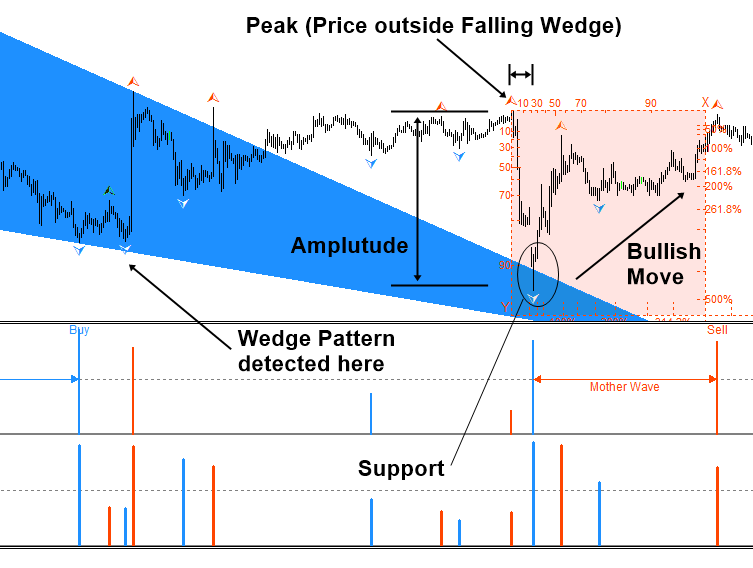
Figure 4.6-11: Falling Wedge pattern act as the support in USDJPY H1 timeframe
About this Article
This article is the part taken from the draft version of the Book: Predicting Forex and Stock Market with Fractal Pattern. This article is only draft and it will be not updated to the completed version on the release of the book. However, this article will serve you to gather the important knowledge in financial trading. This article is also recommended to read before using Fractal Pattern Scanner, which is available for MetaTrader or Optimum Chart.
Below is the landing page for Fractal Pattern Scanner for MetaTrader 4 and MetaTrader 5. The same products are available on www.mql5.com too.
https://www.mql5.com/en/market/product/49170
https://www.mql5.com/en/market/product/49169
https://algotrading-investment.com/portfolio-item/fractal-pattern-scanner/
Below is the landing page for Optimum Chart
https://algotrading-investment.com/2019/07/23/optimum-chart/
More Tips about Falling Wedge Pattern and Rising Wedge Pattern
Here are some more tips about Falling Wedge Pattern and Rising Wedge Pattern to trade in Forex market in regards to the turning point. The Falling Wedge Pattern and Rising Wedge Pattern are two common chart patterns used in technical analysis to predict potential price movements. Let’s delve into each pattern and discuss their turning point probabilities:
Falling Wedge Pattern:
- Description: The Falling Wedge Pattern is a bullish continuation pattern characterized by a series of lower highs and lower lows, converging toward a point. It resembles a narrowing triangle pointing downwards.
- Turning Point Probability: The Falling Wedge Pattern typically appears during a downtrend and signals that the downtrend may be losing momentum. Traders anticipate a potential reversal in the direction of the prevailing trend when the price breaks out above the upper trendline of the wedge. The turning point probability is higher when the breakout is accompanied by increased volume, confirming the strength of the reversal.
Rising Wedge Pattern:
- Description: The Rising Wedge Pattern is a bearish reversal pattern characterized by a series of higher highs and higher lows, converging toward a point. It resembles a narrowing triangle pointing upwards.
- Turning Point Probability: The Rising Wedge Pattern typically appears during an uptrend and signals that the uptrend may be losing steam. Traders anticipate a potential reversal in the direction of the prevailing trend when the price breaks out below the lower trendline of the wedge. The turning point probability is higher when the breakout is accompanied by increased volume, confirming the strength of the reversal.
Probability Factors for Turning Points in Both Patterns:
- Volume Confirmation: An increase in trading volume during the breakout strengthens the validity of the pattern and the likelihood of a turning point.
- Price Target: Traders often use the height of the wedge as a target for the potential move after the breakout. This can help assess the potential magnitude of the turning point.
- Support/Resistance Levels: The presence of significant support or resistance levels near the wedge pattern can influence the probability of a turning point. Breakouts above or below these levels can validate or invalidate the pattern.
- Confirmation from Other Indicators: Confirmation from other technical indicators, such as momentum oscillators or trend-following indicators, can enhance the probability of a turning point indicated by the wedge pattern.
While Falling and Rising Wedge Patterns can provide valuable insights into potential turning points in the market, traders should exercise caution and use additional analysis to confirm signals before making trading decisions. Risk management strategies are also essential to mitigate potential losses in case of false breakouts or unexpected market movements.
Related Products


