Equilibrium Process (Trend)
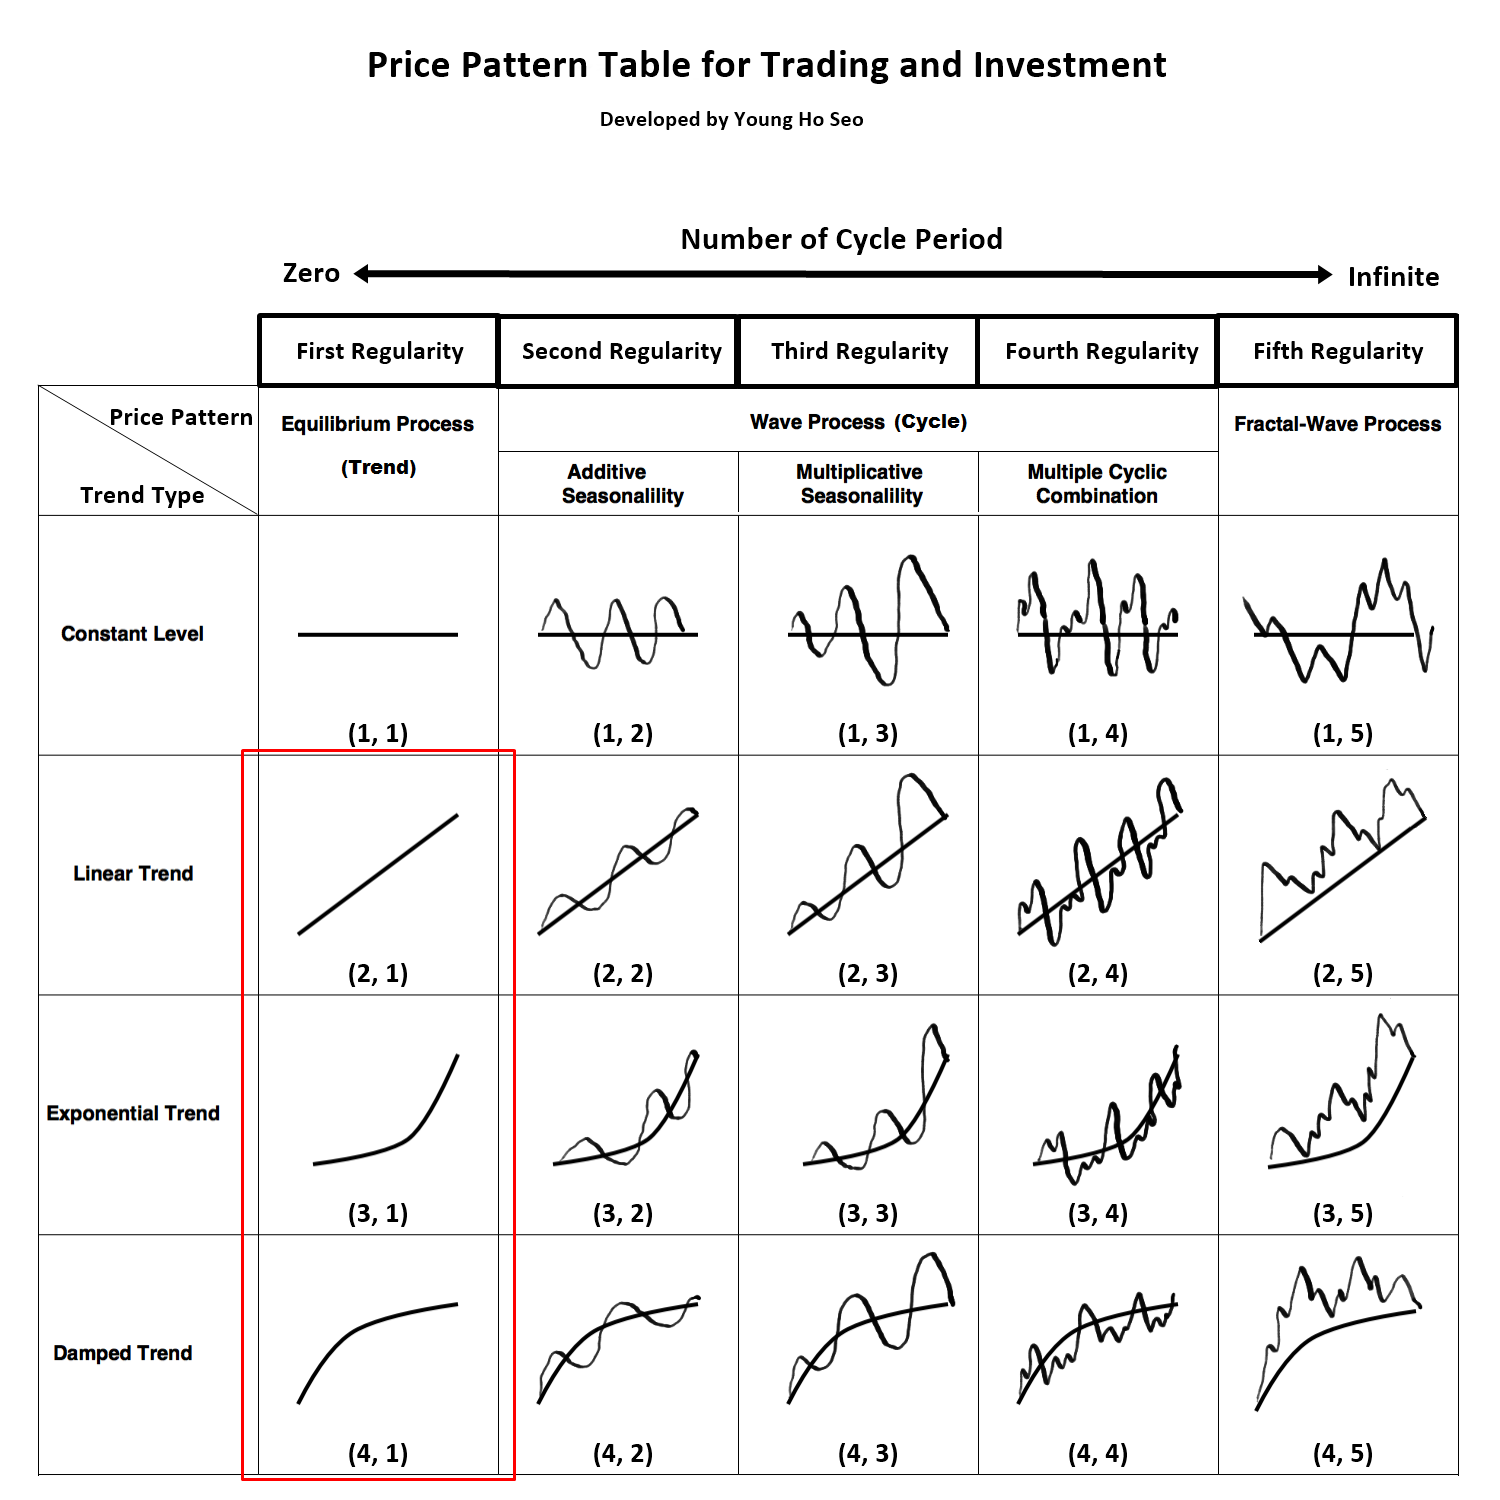
Figure 6-1: Equilibrium process is corresponding to price pattern (2, 1), (3, 1) and (4, 1) in the table.
Simply speaking, Equilibrium process is conceptually similar to trend. It is the market force moving the price series in one direction. Equilibrium process is not different from the equilibrium concept found in the classic supply-demand economic theory. Literally, it is the force to move price to release the unbalance between supply and demand. There are many types of Equilibrium process (trend). They might be linear trend like Pattern (2, 1) in Figure 6-2 or they might be nonlinear trend like Pattern (3, 1) and (4, 1) in Figure 6-2. The three trend patterns, that are linear, exponential and damped, are common. Exponential trend (3, 1) represents the strong trend with increasing momentum. Damped trend (4, 1) represents the trend with reducing momentum. Figure 6-2 presents the six trend patterns for both bullish and bearish markets. These six trend patterns are found most frequently in the financial market comparing to other trend patterns.

Figure 6-2: Trend Patterns for bullish and bearish market.
Equilibrium process is highly related to market fundamentals. Equilibrium process is the direct representation of the supply demand balance in the financial market. Assuming there is the fixed number of shares for Google, if more people want to buy a stock than sell it, then the share price for Google will move up. We call this as a bullish trend. Likewise, if more people want to sell a stock than buy it, there would be greater supply than demand and the price would fall. We call this as a bearish trend. When there is the imbalance in supply and demand force, then the price will try to move towards equilibrium to release the imbalance. The supply demand imbalance is often caused by the fundamental change in the market. For example, change in the taxation or interest rate can change the quantity of supply and demand force dramatically. Natural disasters like Earthquake or Hurricanes or other serious transmissible diseases can influence the dynamics of supply demand too in the financial markets. War, terror, or other political corruption can reduce the demand of the financial assets affected by them.
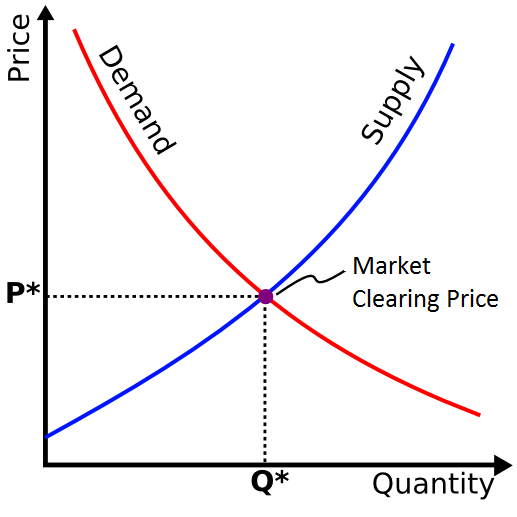
Figure 6-3: Economic Supply Demand curve.
If the Equilibrium process (trend) is overwhelmingly dominating in the price series, prediction is easier. However, the strength of Equilibrium process differs for different financial price series. It is also not easy to quantify or to isolate the portion of Equilibrium process from rest of regularities perfectly. In reality, Equilibrium process can be caused by multiple information sources introduced in different time (Figure 6-4). Each information source will be diffusing across the market in time. Some of them are slowly and some of them are quickly. Some information source will introduce bullish Equilibrium process, which increase demand and reduce supply. Some other information source will introduce bearish Equilibrium process, which reduce demand and increase supply. Since each trader and investor will react differently to different information sources, the diffusion process of each information source can vary dramatically. Modelling or visualization of diffusion process of multiple information sources is complex. If there are many bullish and bearish Equilibrium process acts together in the price series, the simplest way of guessing the market direction is calculating the net of bullish and bearish equilibrium process in the market. However, with simple netting, you will still miss the time factor because each information source will be diffused in different speed. Another difficulty comes from quantifying bullish and bearish strength of each source. Typically, to quantify them correctly, we need good amount of historical data. Especially if you need the accuracy for trading quality, you will need much more data than just doing some academic research. To most of average trader, this is not accessible.
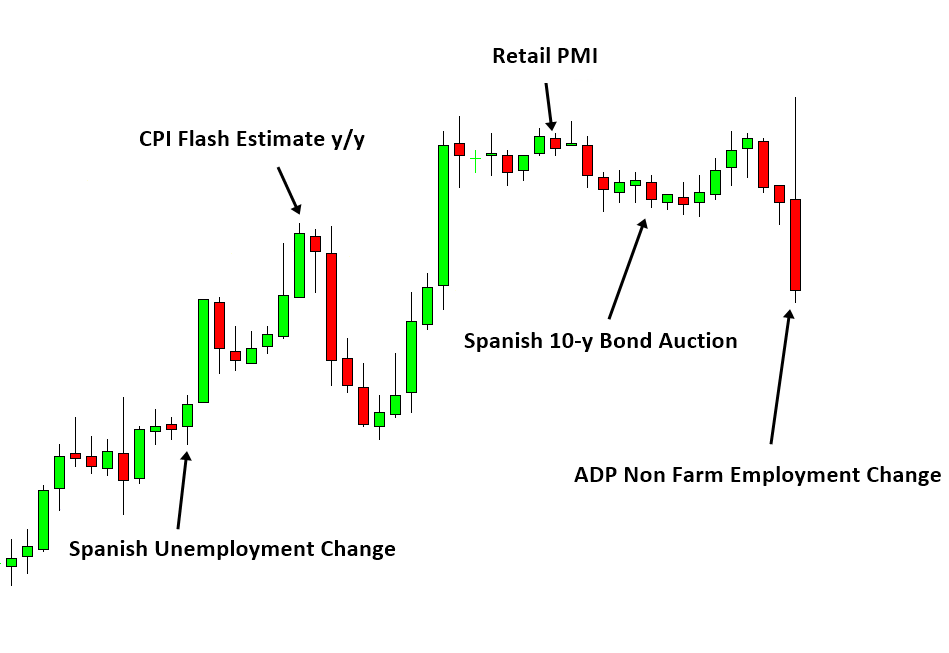
Figure 6-4: EURUSD candlestick chart with various Fundamental Data Release.
Therefore, trader uses technical indicator because technical indicator is simple alternative to the complex diffusion process modelling. Moving average type of technical indicators can work well for this type of market because they eliminate randomness and leave the trend pattern in the price series. Simple moving average, exponential moving average and zero lag moving average can be the great help for this type of market. Normally the strong Equilibrium process can be captured with typical momentum trading strategy. For example, all moving average cross over strategy will work well. In this type of market, following trend is wiser than using the counter trend trading strategy. The real question is “Can we have such a simple market we can trade with moving average alone”? If so, we will be very lucky. Most of time, the financial market will show more complex behaviour, which will be introduced in later chapters. However, in some stock market, you might be able to find few easy opportunities. In Forex market, I think there is not so much opportunity to win with moving average indicator alone.
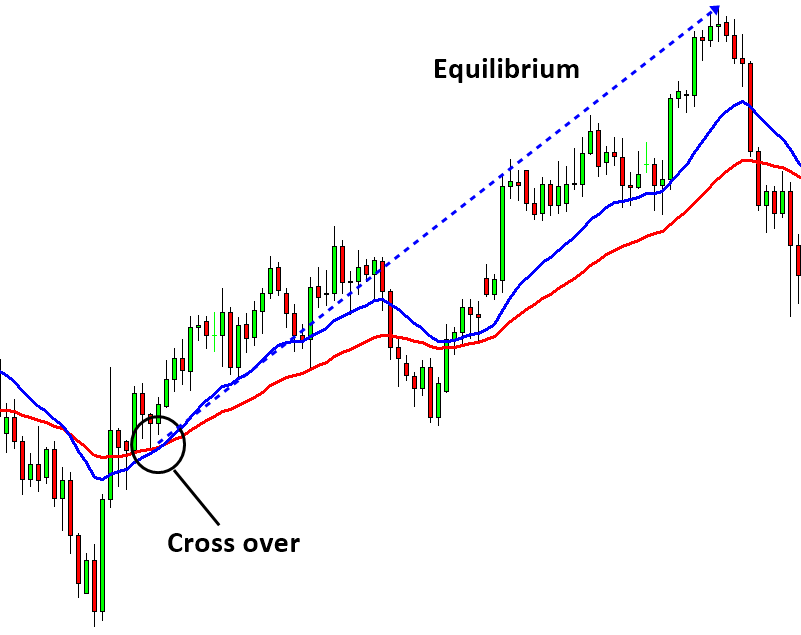
Figure 6-5: Moving Average Cross over strategy. Fast simple moving average is cross over slow simple moving average for buy opportunity.
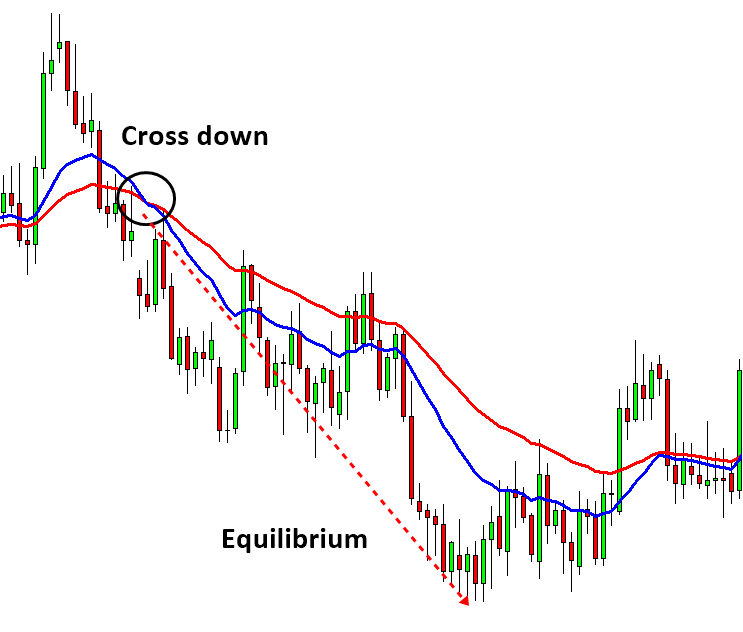
Figure 6-6: Moving Average Cross over strategy. Fast simple moving average is cross down slow simple moving average for sell opportunity.
Some More Tips about Equilibrium in Forex Trading
Equilibrium process in Forex trading refers to the analysis and identification of points where market forces of supply and demand are balanced, leading to a stable price level. Understanding this process helps traders make informed decisions about entry and exit points, manage risk, and predict potential market movements.
Key Concepts of Equilibrium in Forex Trading
- Market Equilibrium:
- Market equilibrium occurs when the quantity of a currency demanded equals the quantity supplied, resulting in a stable price. This balance point can shift due to changes in market conditions, such as economic data releases, geopolitical events, or changes in monetary policy.
- Support and Resistance Levels:
- Support Level: A price level where demand is strong enough to prevent the price from declining further. It acts as a floor that supports the price.
- Resistance Level: A price level where selling pressure is strong enough to prevent the price from rising further. It acts as a ceiling that resists upward movement.
- These levels are critical in identifying equilibrium points where prices might stabilize before making the next move.
- Moving Averages:
- Moving averages (MAs) smooth out price data to identify trends and potential equilibrium points. Common types include the Simple Moving Average (SMA) and the Exponential Moving Average (EMA).
- Crossovers: When a short-term MA crosses above a long-term MA, it signals a potential upward movement and vice versa for downward movements.
- Bollinger Bands:
- Bollinger Bands consist of a moving average with upper and lower bands that are standard deviations away from the MA. They help identify overbought or oversold conditions and potential equilibrium points.
- Fibonacci Retracement and Extension:
- Fibonacci retracement levels (e.g., 38.2%, 50%, 61.8%) are used to identify potential support and resistance levels based on the mathematical ratios derived from the Fibonacci sequence. These levels often coincide with equilibrium points where prices might reverse or consolidate.
Practical Application in Forex Trading
- Identifying Equilibrium Points:
- Use support and resistance levels, moving averages, and Fibonacci retracement levels to identify potential equilibrium points where the price might stabilize or reverse.
- Trade Entries and Exits:
- Entry Points: Enter trades near support levels in an uptrend or resistance levels in a downtrend when the price shows signs of reversal or consolidation.
- Exit Points: Exit trades near resistance levels in an uptrend or support levels in a downtrend to lock in profits or minimize losses.
- Risk Management:
- Place stop-loss orders just beyond identified support or resistance levels to protect against adverse price movements. This helps manage risk by limiting potential losses.
- Combining Indicators:
- Combine equilibrium indicators with other technical analysis tools, such as oscillators (e.g., RSI, MACD) and volume analysis, to enhance the accuracy of your predictions and confirm equilibrium points.
Examples
- Using Moving Averages:
- A trader uses a 50-day SMA and a 200-day SMA to identify equilibrium points. When the 50-day SMA crosses above the 200-day SMA (a golden cross), it indicates a potential bullish trend and a new equilibrium point. Conversely, a death cross (50-day SMA crossing below the 200-day SMA) signals a bearish trend.
- Applying Fibonacci Retracement:
- After a significant price move, a trader draws Fibonacci retracement levels from the swing high to the swing low. The price retraces to the 61.8% level and shows signs of stabilization, indicating a potential equilibrium point and a good entry for a long position.
- Bollinger Bands:
- When the price touches the lower Bollinger Band and begins to move upwards, it indicates the price might be finding equilibrium and is oversold, signaling a potential buy opportunity.
Advantages and Limitations
Advantages:
- Improved Accuracy: Identifying equilibrium points can improve the accuracy of trade entries and exits.
- Risk Management: Helps in setting effective stop-loss and take-profit levels.
- Trend Confirmation: Assists in confirming trend reversals and continuations.
Limitations:
- False Signals: In volatile markets, equilibrium indicators can give false signals.
- Lagging Indicators: Some tools like moving averages are lagging indicators and may not react quickly to sudden market changes.
- Complexity: Requires combining multiple indicators and a thorough understanding of market dynamics.
Conclusion
The equilibrium process in Forex trading is crucial for understanding where the market might stabilize, reverse, or continue its trend. By using support and resistance levels, moving averages, Bollinger Bands, and Fibonacci retracement levels, traders can identify these equilibrium points and make more informed trading decisions. While this approach has its limitations, it significantly enhances a trader’s ability to predict market movements and manage risk effectively.
About this Article
This article is the part taken from the draft version of the Book: Scientific Guide to Price Action and Pattern Trading (Wisdom of Trend, Cycle, and Fractal Wave). Full version of the book can be found from the link below:
You can also use Ace Supply Demand Zone Indicator in MetaTrader to accomplish your technical analysis. Ace Supply Demand Zone indicator is non repainting and non lagging supply demand zone indicator with a lot of powerful features built on.
https://www.mql5.com/en/market/product/40076
https://www.mql5.com/en/market/product/40075
https://algotrading-investment.com/portfolio-item/ace-supply-demand-zone/
Below is the landing page for Optimum Chart (Standalone Charting and Analytical Platform).
https://algotrading-investment.com/2019/07/23/optimum-chart/
Related Products


