Wave Process (Cycle)
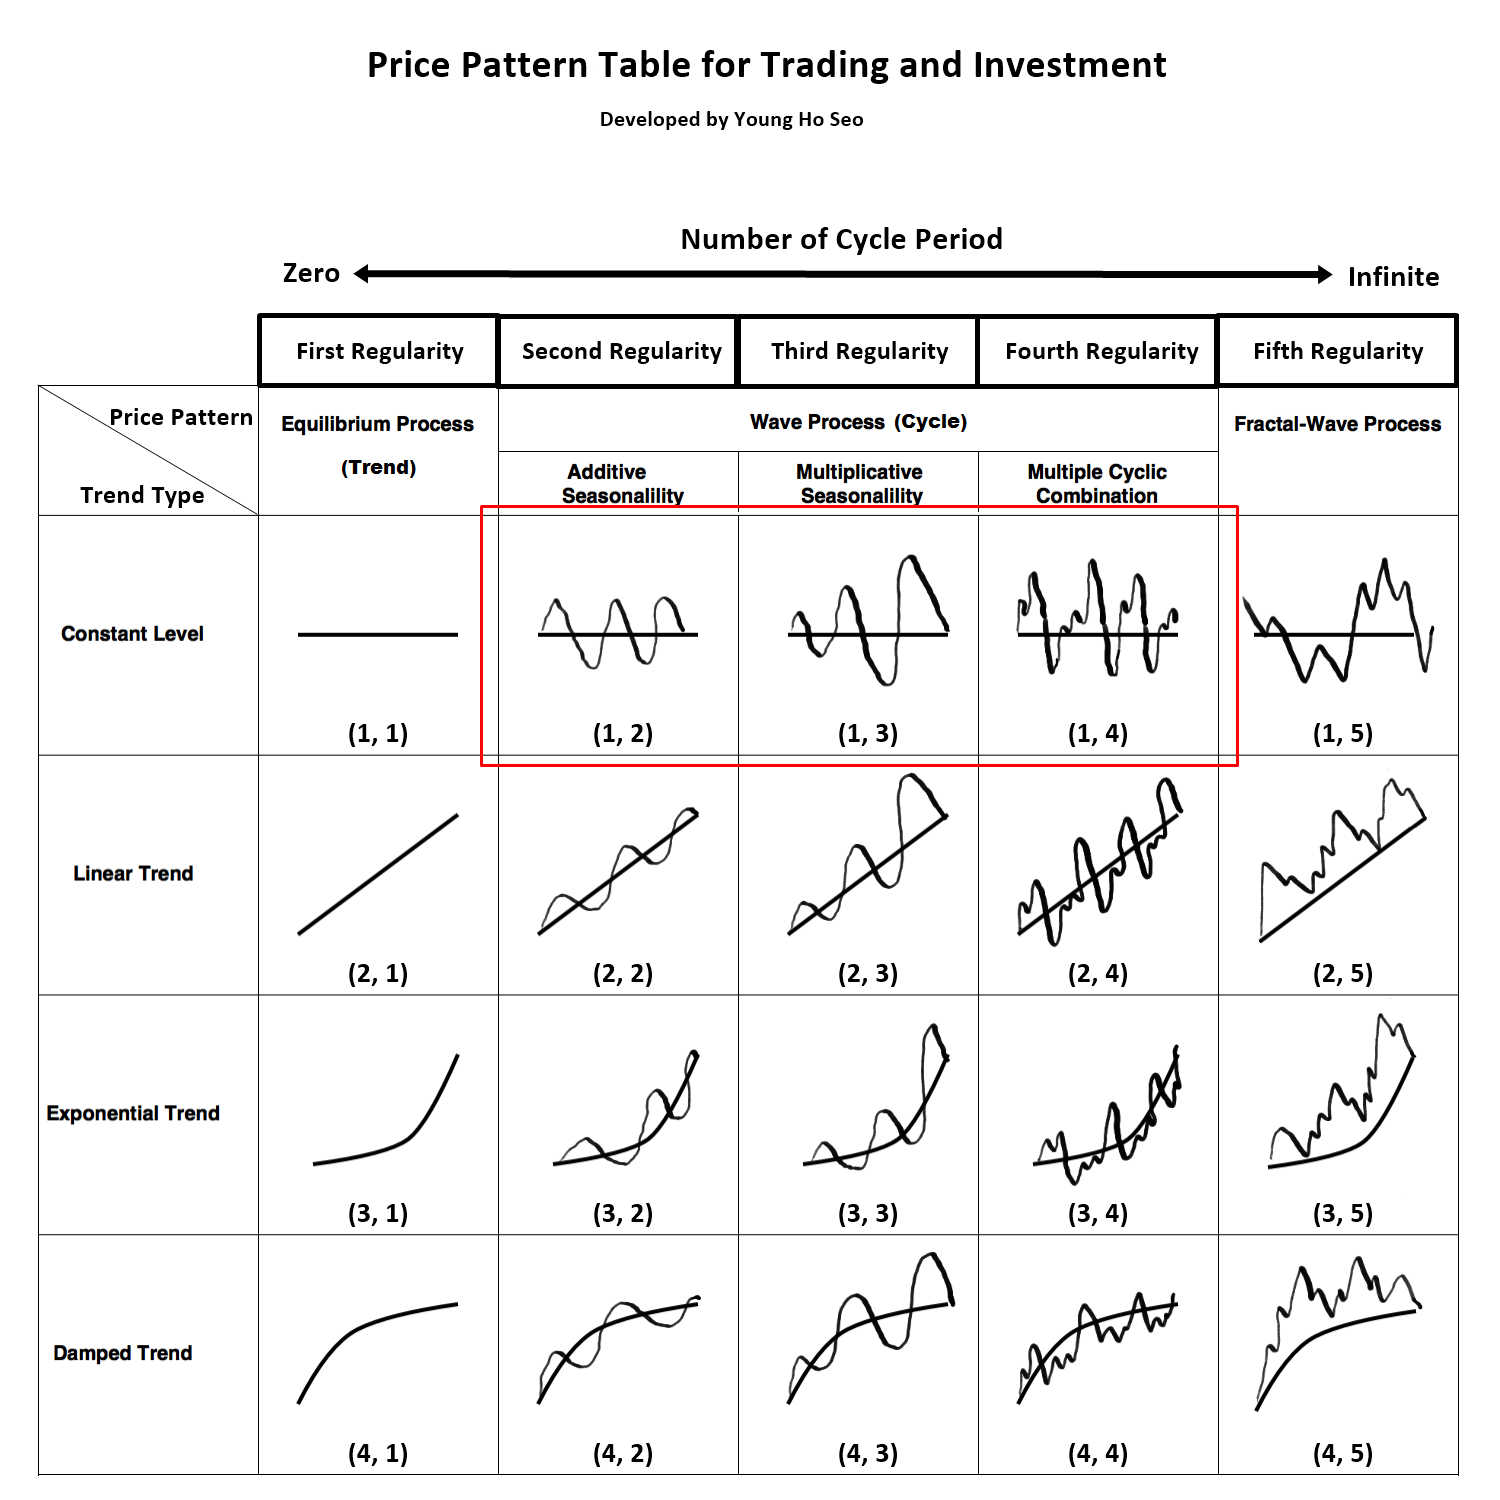
Figure 7-1: Wave process is corresponding to price pattern (1, 2), (1, 3) and (1, 4) in the table.
Wave process is any cyclic patterns repeating in the fixed time interval. Two main references for Wave process can be found from Physics and Time series Analysis. Both references deal exclusively with periodic cycle of an object or a signal. However, they use different methodology to describe the periodic cycle. In physics, wave is the main term describing the periodic cycle of an object or a signal. In time series analysis, the term “Seasonality” is used to deal with seasonal fluctuations in the price series. In the Price Pattern Table (Figure 7-1), Wave Process covers both wave in Physics and seasonality in time series analysis. To better illustrate the Wave process, we provide simple description for Wave and Seasonality in this section.
In Physics, Wave can be described by three independent variables, which are frequency, wavelength and amplitude. Frequency is the number of waves passing a point in certain time interval. Scientists and engineers normally use a time of one second. Therefore, number of waves passing a point in 1 second is described by the unit called Hertz. 1 Hertz equals to one Wave per second. Wavelength is the distance from any point on one wave to the same point on the next wave along. Amplitude is the height of wave from the top of a crest to the centre line of the wave.
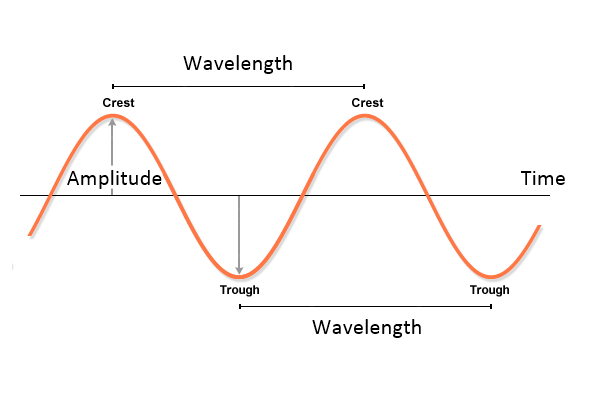
Figure 7-2: Description of Wave in Physics.
Normally textbook will show you a clean sine or cosine wave function to describe the property of wave. In the real world, the wave often consists of multiple cyclic components. For example, Figure 7-3 shows the synthetic multiple cycles built by adding three Sine Wave Functions: Sine (2x) + Sine (13x) + Sine (30x). Many real world signals can have more complex cyclic structure than this example. In addition, many real world signal will exhibit decreasing or increasing amplitude to make your analysis more difficult as shown in Figure 7-4.
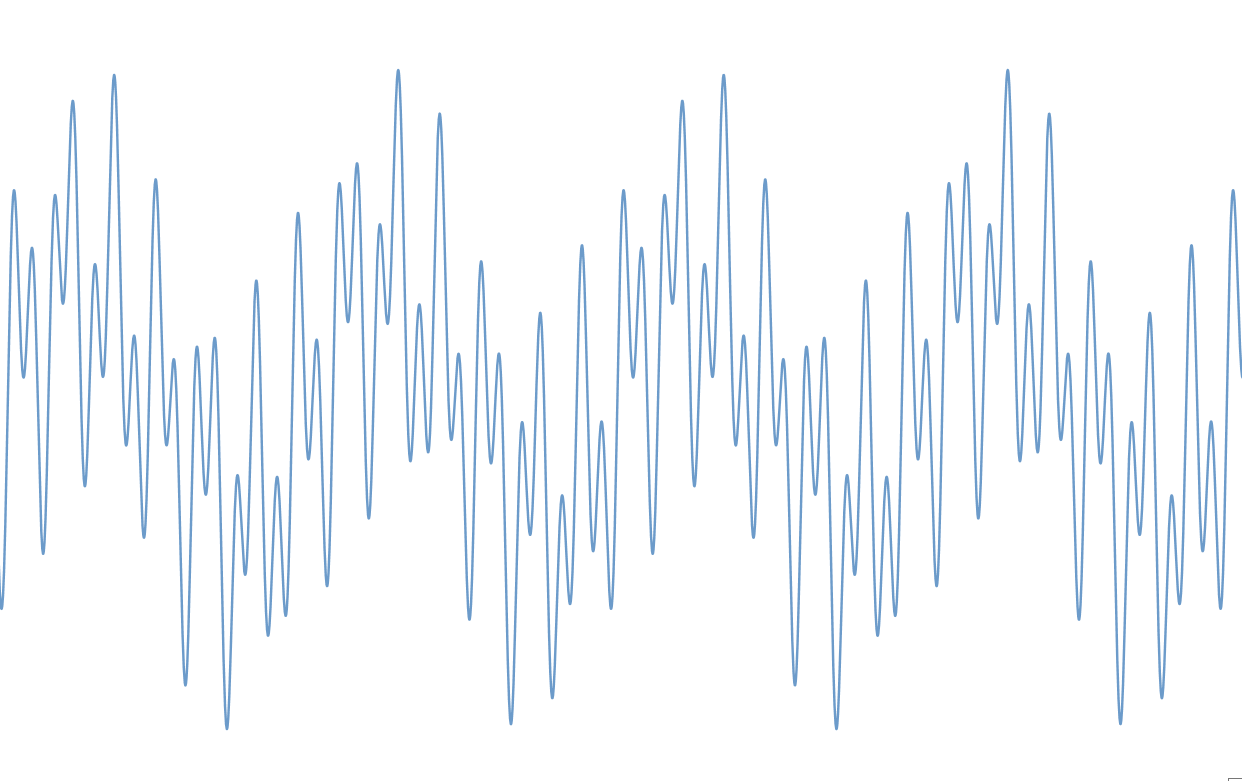
Figure 7-3: Synthetic Cyclic Function of Sine (2x) + Sine (13x) + Sine (30x).
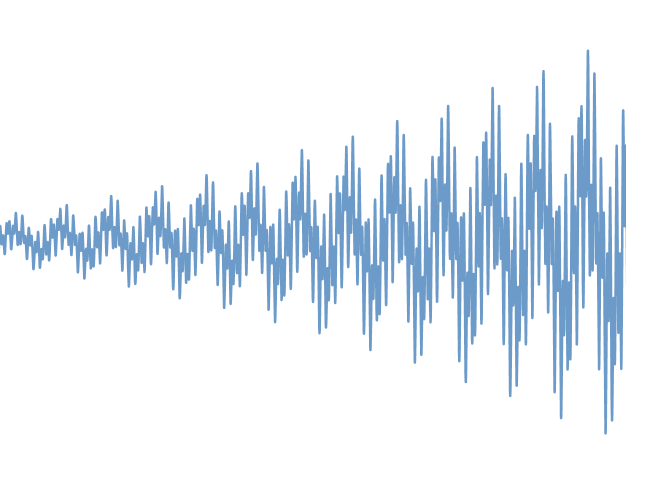
Figure 7-4: Synthetic Cyclic Function with increasing amplitude.
In time series analysis, seasonal fluctuation is described with smoothing factor gamma and previous seasonal level. Alternatively, one can use multiple regression with dummy variable or artificial intelligence techniques for the same task. Figure 7-5 shows typical annual seasonal fluctuations in the data. This type of series can be modelling using either additive seasonality or multiplicative seasonality.
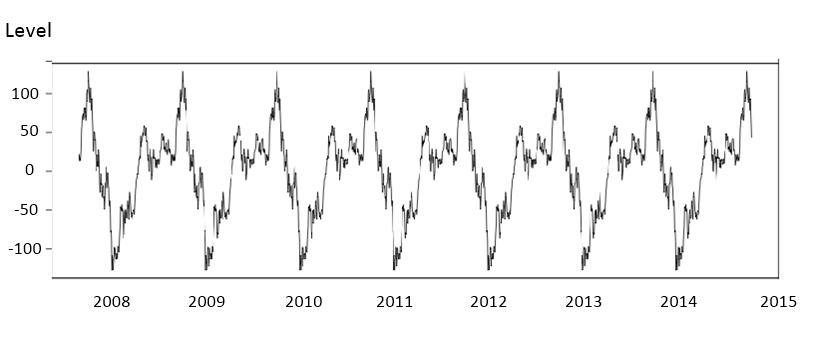
Figure 7-5: Annual Seasonal fluctuations in the price series.
The ways to describe periodic wave in physics and in time series analysis are different. However, in fact, two concepts are still the very same thing. The main difference of the seasonality from the periodic wave in Physics is that seasonality are normally assumed to have some common seasonal period in calendar like hourly, daily, monthly or quarterly. Although modelling methodology might differ, the seasonality can be detected with Fourier Transformation and periodogram equally well. One disadvantage of seasonality in time series is that the math become quite complex if we have to model multiple seasonality. For example, if we have more than three distinctive seasonal fluctuations in our data, say hourly daily, weekly and monthly, then it is quite difficult to model using seasonal exponential smoothing model. At the same time, multiple periodic cycles present in price series can be modelled readily with combination of sine and cosine curve with various amplitude and wavelength.
It is very difficult to observe any strong seasonality in Forex market data. It is probably because the currency markets are traded all years around with high trading volume. However, some weak form of seasonality might be observed from Stock market and commodity market. If any price series shows wave process (cycle), then it is important to define seasonal period, the time interval repeating its cycle. With the identified seasonal period, one can determine period where price stays below or above the seasonal average for your trading advantage. For example, in Figure 7-6, we can observe some bullish effect on April and December on S&P500 monthly data. It is rare for forex trader. However, there are still many group of traders looking for seasonality in Stock market.
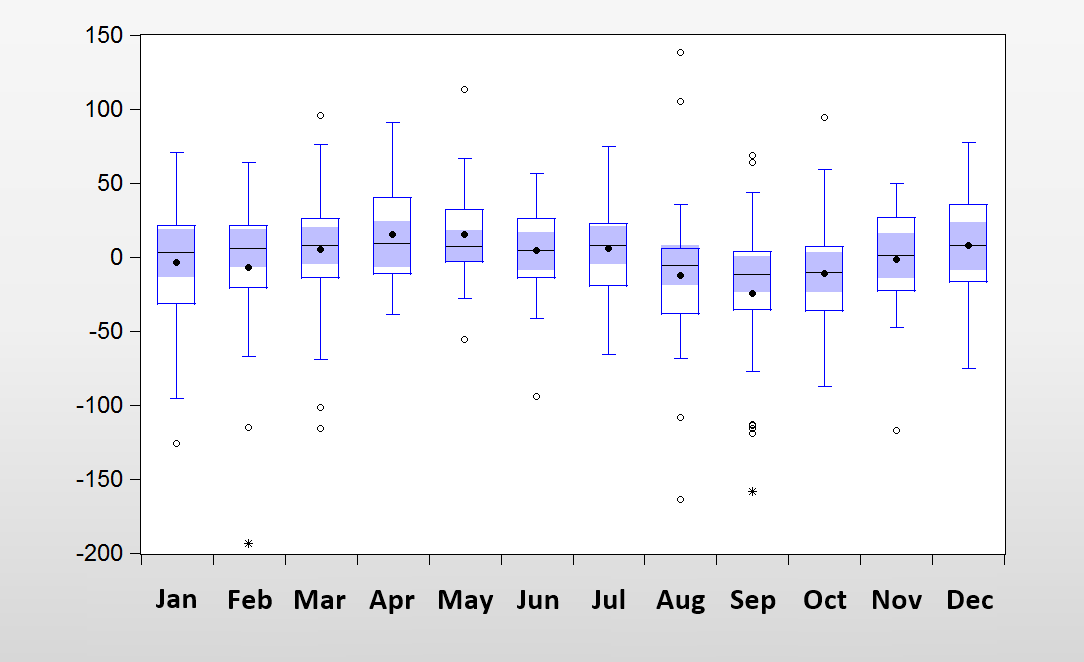
Figure 7-6: Seasonal Effects of the S&P 500 monthly price series. Seasonality was extracted from the central moving average construction.
Analytical Note
The simplest ways to identify the seasonality is to draw seasonal plot as shown in Figure 7-7. To draw seasonal plot, one have to partition the price series into sub series each year when the seasonal period is annual. For example, if you have 20 years historical price series, then you will have 20 sub series for each year. Once you have partitioned the price series, create stacked plot of each sub series as shown in Figure 7-7. If your data has seasonality, then you will normally observe some patterns across each month. Complex methods of detecting seasonality include periodogram and Partial autocorrelation function.
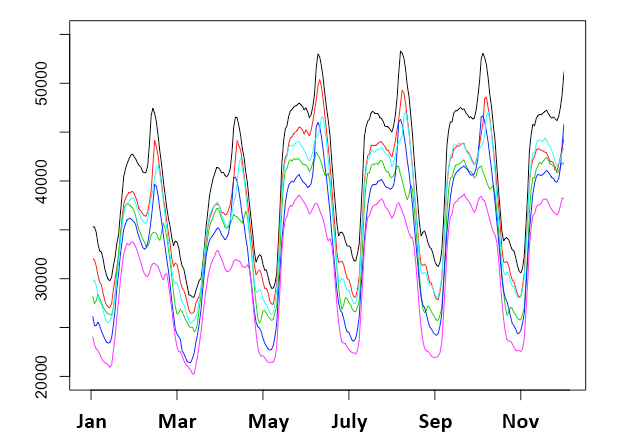
Figure 7-7: Example Seasonal plot for 6 years of historical price series.
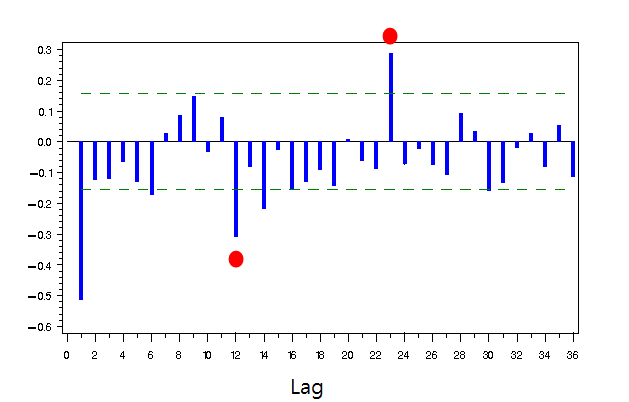
Figure 7-8: Example Partial Autocorrelation Function exhibiting seasonality in the data. Red Circle indicates that 12-month cycle of price series.
Some More Tips about Wave Process in Forex Trading
Wave process in Forex trading primarily refers to the use of wave theory, particularly Elliott Wave Theory, to analyze and predict market movements. This approach is based on the idea that market prices move in repetitive wave patterns influenced by investor psychology and market sentiment.
Elliott Wave Theory
Elliott Wave Theory, developed by Ralph Nelson Elliott in the 1930s, posits that financial markets follow specific patterns or “waves” that are influenced by the collective behavior of investors. According to Elliott, market prices unfold in a series of waves that can be categorized into two main types: impulsive waves and corrective waves.
Key Components of Elliott Wave Theory
- Impulsive Waves (Motive Waves):
- These waves move in the direction of the main trend.
- An impulsive wave consists of five sub-waves: three motive waves (1, 3, 5) and two corrective waves (2, 4).
- Waves 1, 3, and 5 are the primary trend waves, while waves 2 and 4 are counter-trend waves.
- Corrective Waves:
- These waves move against the direction of the main trend.
- A corrective wave consists of three sub-waves: two motive waves (A, C) and one corrective wave (B).
- The structure is often labeled as an ABC pattern.
Detailed Structure
Impulsive Wave Structure
- Wave 1: The initial move in the direction of the trend. It may not be very obvious initially as it can often appear as a counter-trend move.
- Wave 2: A corrective wave that retraces a portion of Wave 1, but not all of it.
- Wave 3: The longest and strongest wave, characterized by a significant move in the direction of the trend. This wave often exhibits high trading volume.
- Wave 4: Another corrective wave that retraces a portion of Wave 3, typically less intense than Wave 2.
- Wave 5: The final impulsive wave in the sequence, moving in the direction of the trend. Wave 5 often lacks the strength of Wave 3.
Corrective Wave Structure
- Wave A: The initial move against the main trend, often mistaken for a minor correction.
- Wave B: A partial retracement of Wave A, which can sometimes appear like a resumption of the main trend.
- Wave C: A continuation of the move initiated by Wave A, often as long or longer than Wave A.
Practical Application in Forex Trading
- Identifying Trends:
- Traders use Elliott Wave Theory to identify the primary trend and potential reversal points. Recognizing the current wave position helps in predicting future price movements.
- Setting Entry and Exit Points:
- Entry points can be identified at the beginning of impulsive waves (Waves 1, 3, or 5) or corrective waves (Wave C).
- Exit points are often set near the end of impulsive waves or corrective waves.
- Risk Management:
- Stop-loss orders are typically placed just beyond the extremes of the identified waves to protect against adverse movements.
- Combining with Other Indicators:
- Elliott Wave analysis is often combined with other technical analysis tools like Fibonacci retracement and extension levels, moving averages, and momentum indicators to enhance the accuracy of predictions.
Examples of Wave Patterns
- Five-Wave Impulsive Pattern:
- The price moves upward in five waves: three upward waves (1, 3, 5) and two downward corrective waves (2, 4).
- Three-Wave Corrective Pattern (ABC Correction):
- After a five-wave move, the price typically moves in a three-wave corrective pattern labeled A, B, and C.
Advantages and Limitations
Advantages:
- Predictive Power: Provides a structured way to predict future market movements based on historical price patterns.
- Versatility: Applicable to various markets and time frames.
- Depth of Analysis: Offers a comprehensive framework to understand market psychology and investor behavior.
Limitations:
- Complexity: Requires significant expertise and experience to identify and interpret wave patterns accurately.
- Subjectivity: Interpretation of waves can vary among traders, leading to potential discrepancies.
- Market Conditions: May not work well in highly volatile or sideways markets where clear wave patterns are difficult to discern.
Conclusion
The wave process in Forex trading, particularly through Elliott Wave Theory, provides a powerful method for analyzing and predicting market trends. By understanding and identifying impulsive and corrective waves, traders can make informed decisions about entry and exit points, trend identification, and risk management. However, successful application of this theory requires a deep understanding of wave structures, experience in pattern recognition, and often the use of supplementary technical analysis tools.
About this Article
This article is the part taken from the draft version of the Book: Scientific Guide to Price Action and Pattern Trading (Wisdom of Trend, Cycle, and Fractal Wave). Full version of the book can be found from the link below:
Fractal Pattern Scanner provides the way to measure the fractal cycles in forex and stock market data. In addition, the turning Point Probability and trend Probability can be measured with Fractal Pattern Scanner at every price action in your chart. For the simplest usage, Fractal Pattern Scanner can turn the simple support and resistance to the powerful killer strategy. Below is the landing page to Fractal Pattern Scanner in MetaTrader 4 and MetaTrader 5.
https://www.mql5.com/en/market/product/49170
https://www.mql5.com/en/market/product/49169
https://algotrading-investment.com/portfolio-item/fractal-pattern-scanner/
Below is the landing page for Optimum Chart (Standalone Charting and Analytical Platform).
https://algotrading-investment.com/2019/07/23/optimum-chart/
Related Products


