Stationary Process (No Trend)
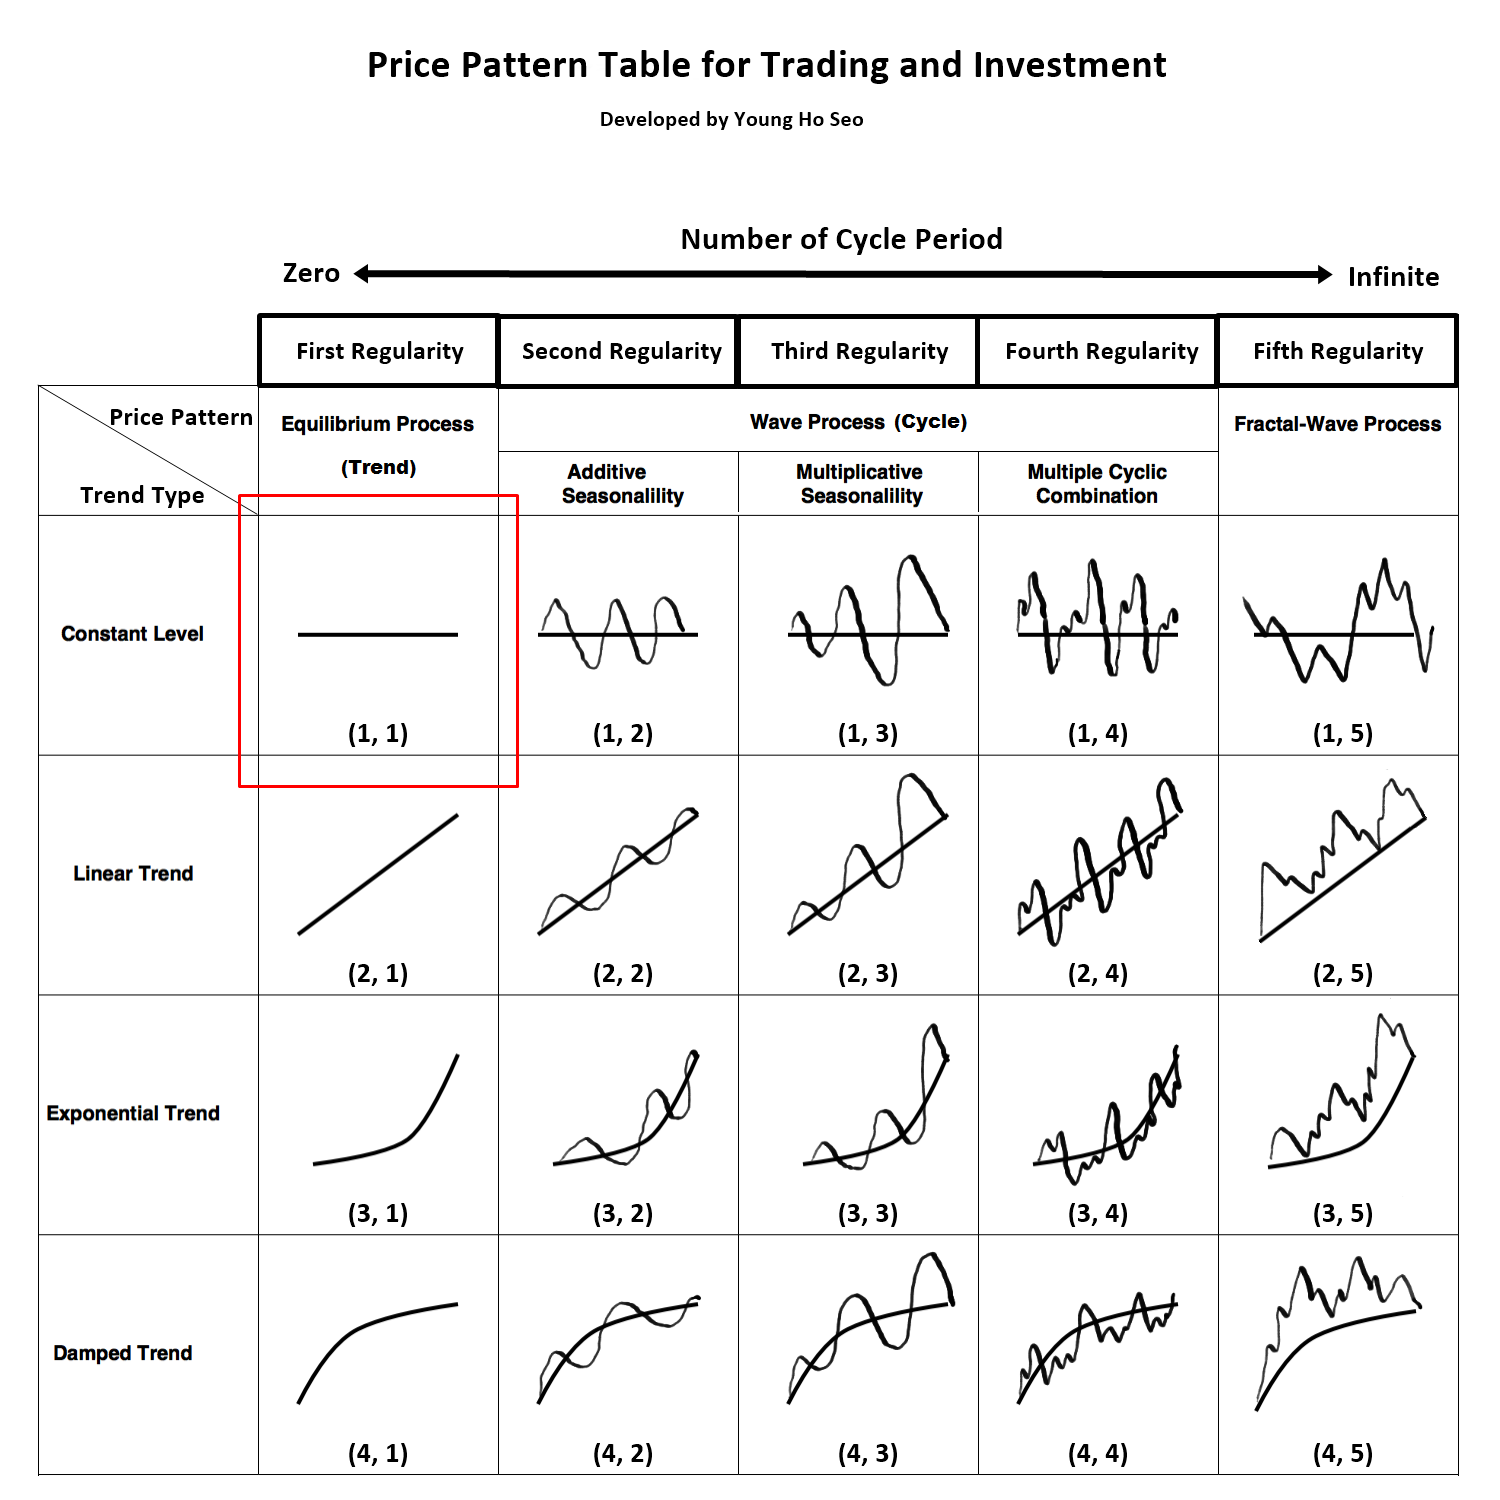
Figure 5-1: Stationary Process is corresponding to Pattern (1, 1) in the table.
Simply speaking stationary process is the horizontal pattern where price series fluctuates around a constant mean. As you might guess, it is a mathematical term. You might be unfamiliar with this term. However, it is no point to reinvent the wheel again when the wheel is already there. Hence, we will stick with this term. Stationary process describes the pattern (1, 1) best on the Table in Figure 3-3. If price series is exhibiting stationary process, you will not able to observe a notable trend in the prices series. On the other hands, if the price series are non-stationary, then the variance and mean will change over time. You have to understand that having constant mean or not can change your trading outcome dramatically. Among many mathematical and institutional trader, stationarity is one fundamental factor in deciding their trading strategy. To give you better idea about stationary, we have removed trend in EURUSD artificially in Figure 5-2. You can see that the price series is always try to go back to its mean in Figure 5-2. The original EURUSD series will never look like this because they have trend as shown in Figure 5-3.
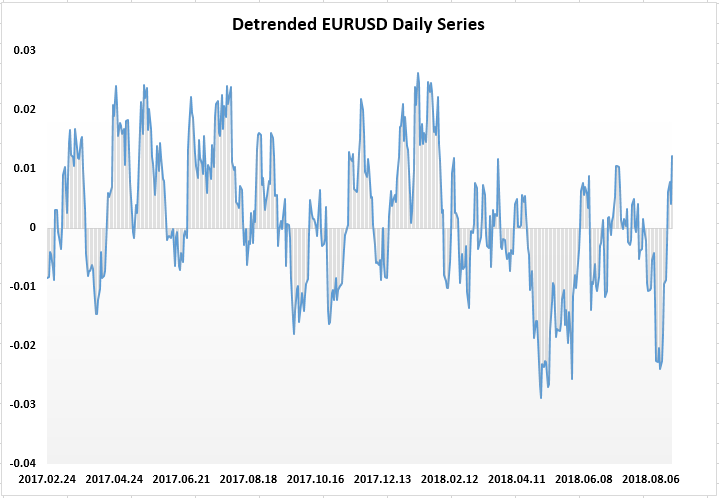
Figure 5-2: De-trended EURUSD Series Daily timeframe is a good example of stationary series.
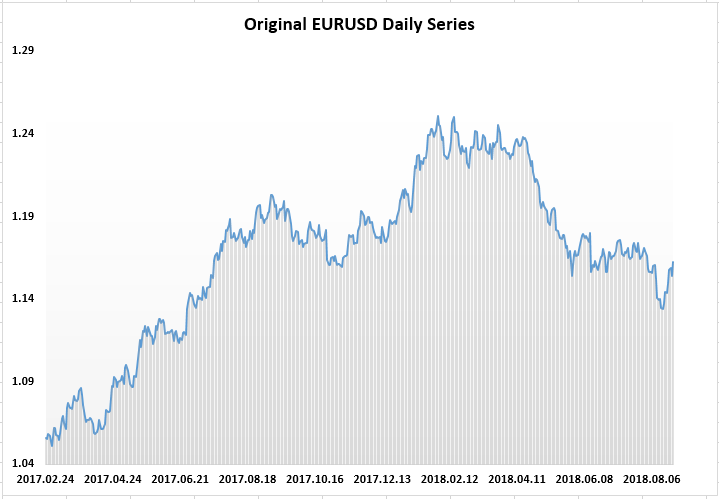
Figure 5-3: Original EURUSD Series Daily timeframe. This is a good example of non-stationary series.
White noise series are another example of stationary because they are fluctuating around the mean. In contrast, random walk series in Figure 4-2 does not fluctuate around the one level like white noise series does. Therefore, random walk series in Figure 4-2 is not stationary. Very few commodity and stock price series can exhibit strong stationarities in its original form. Most of time, many Stock, and currency price series are non-stationary meaning that they are not coming back to the mean. In fact, you can find many ratio series are stationary. For example, the ratio series of S&P 500 and earning is well known stationary series (Figure 5-4). Typically, the ratio of S&P 500 and its earning tends to revert to the mean. Many traders make use of this fact for their trading. In addition, many ratio series of currency pairs can be stationary too. This assumption is the basis for the popular Pairs Trading.
Normally the very first step of analysing any financial price series involves checking if they are stationary or non-stationary. This horizontal pattern is very important in determining your trading strategy. For example, if any price series exhibit stationary process, then mean reversion-trading strategy is good. If the price series are non-stationary, then choice of trading strategy is dependent on type of dominating regularities in the financial price series. Now you wander how to detect stationarity of the price series. In fact, some well-trained eyes can tell the stationary by visual inspection from the chart. You will mostly focus on looking for the horizontal pattern. However, it is common to use a statistical testing to check the stationarity of the price series.
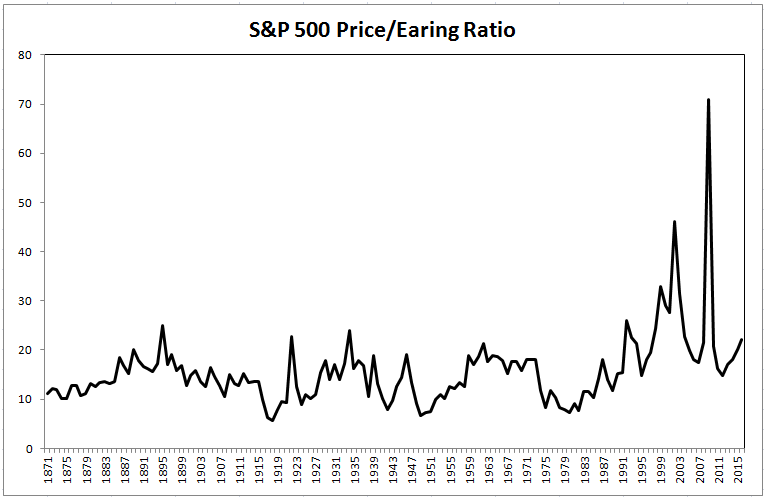
Figure 5-4: S&P 500 Price/Earning series. This is a good example of stationary process.
Trading Strategy Note
It is less common to see any financial price series in stocks and forex market exhibiting strong stationary process. Having said that, if any financial price series show stationarity, then it is extremely easy to trade with this series. Therefore, you should always check if such an opportunity exists first before using any other complex trading strategy. For the stationary price series, trader can use the typical mean reversion trading strategy. For example, one can buy if the price stays below three standard deviations from the mean. One can sell if the price stays above three standard deviations from the mean. Sometimes one can use four standard deviation rule instead of three standard deviation rule. You can look at ratio for the potential trading opportunities. For example, Price/Earnings ratios are popular ways to trade Stock market. Trader can also use Price/Price ratio too for Pairs trading opportunities.

Figure 5-5: Mean reversion trading scenario for stationary price series.
Analytical Note
You can use several different techniques to confirm stationarity of the price series. Mostly the testing procedures are based on the statistical Hypothesis Testing. The commonly used one is the Augmented Dickey Fuller test. Some other techniques include Philipps-Perron test, KPSS test and Variance Ratio test. In addition, Hurst Exponent might be used to check the stationary characteristics of the price series too. Since price series might show stationarity during some period of the data set temporally, it is important to use the entire data set to test stationarity. It is often better to use more than one techniques to confirm stationarity for better accuracy. If you have no access to these testing tools, then you can simply make the visual inspection on your chart.
Some More Tips about Stationary Process in Forex Trading
In Forex trading, a stationary process refers to a time series whose statistical properties, such as mean, variance, and autocorrelation, remain constant over time. Understanding and identifying stationary processes is crucial because many statistical and machine learning models used for forecasting and analysis assume that the underlying data is stationary. When a time series is not stationary, it can lead to inaccurate predictions and misinterpretations of market behavior.
Key Concepts of Stationary Processes
- Definition of Stationarity:
- A time series is stationary if its statistical properties do not change over time. This means the mean, variance, and autocorrelation structure are constant.
- Types of Stationarity:
- Strict Stationarity: The joint distribution of any set of observations is identical regardless of time shifts.
- Weak (or Second-Order) Stationarity: Only the first two moments (mean and variance) and autocovariance structure are constant over time.
- Non-Stationary Processes:
- A non-stationary time series has properties that change over time. Common examples include trends, seasonality, and varying volatility.
Importance in Forex Trading
- Model Assumptions:
- Many predictive models, such as ARIMA (AutoRegressive Integrated Moving Average), assume the data is stationary. Using non-stationary data with these models can lead to unreliable forecasts.
- Statistical Inference:
- Stationary processes allow for consistent and reliable statistical inference, making it easier to identify underlying patterns and relationships in the data.
Identifying Stationarity
- Visual Inspection:
- Plot the time series and look for constant mean and variance. Trends or patterns indicate non-stationarity.
- Statistical Tests:
- Augmented Dickey-Fuller (ADF) Test: Tests the null hypothesis that a unit root is present in the time series (i.e., the series is non-stationary).
- Phillips-Perron (PP) Test: Similar to ADF but accounts for serial correlation and heteroskedasticity in the error terms.
- Kwiatkowski-Phillips-Schmidt-Shin (KPSS) Test: Tests the null hypothesis that the series is stationary.
- Autocorrelation Function (ACF) and Partial Autocorrelation Function (PACF):
- Examine the ACF and PACF plots. A slow decay indicates non-stationarity, while a quick drop suggests stationarity.
Transforming Non-Stationary Data to Stationary
- Differencing:
- Subtract the previous observation from the current observation. This process can be repeated (first difference, second difference) until stationarity is achieved.
- Log Transformation:
- Apply a logarithm to stabilize the variance.
- De-trending:
- Remove the trend component from the series.
- Seasonal Adjustment:
- Remove seasonal effects using methods like Seasonal Decomposition of Time Series (STL).
Practical Application in Forex Trading
- Forecasting Models:
- ARIMA Model: Combines autoregression, differencing, and moving average components. It requires the time series to be stationary. The ARIMA model is commonly used for predicting future currency prices.
- GARCH Model: Generalized Autoregressive Conditional Heteroskedasticity model is used for modeling volatility. It also assumes stationarity in the variance of the time series.
- Technical Analysis:
- Stationary processes are used in various technical indicators. For example, moving averages and Bollinger Bands assume some form of stationarity to provide meaningful insights.
- Algorithmic Trading:
- Algorithms rely on stationary data for backtesting and optimization. Ensuring stationarity improves the robustness of trading strategies.
Examples
- Stationary Series:
- A currency pair’s daily returns might exhibit stationarity if the returns’ mean and variance are constant over time.
- Non-Stationary Series:
- The actual price level of a currency pair is often non-stationary due to trends and changing economic conditions.
Advantages and Limitations
Advantages:
- Reliable Predictions: Stationary series provide a stable basis for forecasting models, leading to more accurate predictions.
- Statistical Validity: Ensures the validity of statistical tests and inferences.
Limitations:
- Data Transformation: Converting non-stationary data to stationary can sometimes lead to loss of information or added complexity.
- Assumption Constraints: Some market behaviors might be inherently non-stationary, challenging the applicability of certain models.
Conclusion
Understanding stationary processes in Forex trading is crucial for building reliable predictive models and making informed trading decisions. By identifying and transforming non-stationary data, traders can ensure their analysis and models are robust, leading to more accurate forecasts and better risk management. Tools like the ADF test, differencing, and log transformation are essential for working with time series data in the dynamic Forex market.
About this Article
This article is the part taken from the draft version of the Book: Scientific Guide To Price Action and Pattern Trading (Wisdom of Trend, Cycle, and Fractal Wave). This article is only draft and it will be not updated to the completed version on the release of the book. However, this article will serve you to gather the important knowledge in financial trading. This article is also recommended to read before using Price Breakout Pattern Scanner, Advanced Price Pattern Scanner, Elliott Wave Trend, EFW Analytics and Harmonic Pattern Plus, which is available for MetaTrader 4 and MetaTrader 5 platform.
Below is the landing page for Price Breakout Pattern Scanner, Advanced Price Pattern Scanner, Elliott Wave Trend, EFW Analytics and Harmonic Pattern Plus. All these products are also available from www.mql5.com too.
https://algotrading-investment.com/portfolio-item/price-breakout-pattern-scanner/
https://algotrading-investment.com/portfolio-item/advanced-price-pattern-scanner/
https://algotrading-investment.com/portfolio-item/elliott-wave-trend/
https://algotrading-investment.com/portfolio-item/equilibrium-fractal-wave-analytics/
https://algotrading-investment.com/portfolio-item/harmonic-pattern-plus/
Related Products


