Identification of Support and Resistance with the Template and Pattern Approach
When you detect the support and resistance in your chart, it is important that you are trading with quality support and resistance. In our 1st training, we have shown how to use the Peak Trough Analysis to study the Equilibrium Fractal Wave patterns in your chart. Once again, the Peak Trough Analysis can be used as a starting template for support and resistance identification. However, the use of template is not compulsory though. In addition, it should be noted that the Peak Trough Analysis could only provide the rough guideline for the identification of the support and resistance. In spite of the fact that the Peak Trough Analysis is not the perfect tool to identify the support and resistance, I found that at least it is extremely useful tool for starters because it provides some starting points. It can be even useful for the experienced trader too. To detect the high quality support and resistance lines, you can consider few things. In detecting the support and resistance, you might use the following general rules:
- Apply Peak Trough Transformation to visualize the important peaks and troughs in your chart.
- Connect peak to peak to detect resistances and connect trough to trough to detect supports (i.e. do not mix peak and trough.)
- There should be at least three touches around the support and resistance
- You can expect that most of time the touching point over support and resistance will not be dead accurate but you can use 5% or 10% margin to detect the support and resistance. 5% and 10% margin can be measured in relative to the triangle height. You can use the same method to calculate Y Buy and Y Sell for 5% and 10% margin calculation.
- Each touching point should have some distance from the adjacent touching point. If two touching points are too close to each other, then count them as one touching point only.
For your convenience, we provide the simplified diagram for each support and resistance patterns in Figure 2-15. In addition, we have listed the twelve support and resistance patterns and their price action in the Table 2-3. These six support and resistance patterns can be used for your trading without any other additional tool. However, it is possible that you can combine these patterns with other trading strategies, which we will discuss in the next chapter. As we will explain in the later chapter, typically the combined trading strategy can provide the powerful entry with higher winning rate. At the same time, these six support and resistance patterns can be the backbone of other price patterns. Most of Triangle, Wedge and Channel patterns shown in Figure 2-16 can be expressed in terms of these six support and resistance patterns in Figure 2-15. For example, the symmetric triangle price pattern can be made from one ascending diagonal support and one descending diagonal resistance. Likewise, other triangle and wedge patterns can be expressed using Support and Resistance patterns too. We list the Triangle, Wedge and Channel patterns and their sub price patterns in Table 2-4.
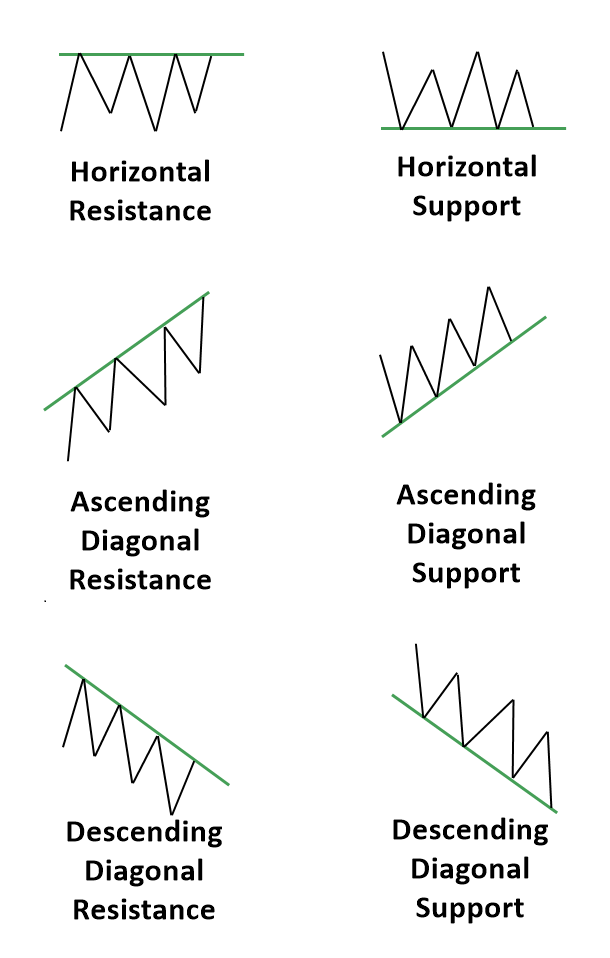
Figure 2-15: List of six support and resistance patterns.
| Support and resistance | Price Action | Direction | Example |
| Horizontal Support | Reversal | Buy | Figure 2-1 |
| Horizontal Support | Breakout | Sell | Figure 2-2 |
| Horizontal Resistance | Reversal | Sell | Figure 2-3 |
| Horizontal Resistance | Breakout | Buy | Figure 2-4 |
| Ascending Diagonal Support | Reversal | Buy | Figure 2-6 |
| Ascending Diagonal Support | Breakout | Sell | Figure 2-7 |
| Ascending Diagonal Resistance | Reversal | Sell | Figure 2-8 |
| Ascending Diagonal Resistance | Breakout | Buy | Figure 2-9 |
| Descending Diagonal Support | Reversal | Buy | Figure 2-10 |
| Descending Diagonal Support | Breakout | Sell | Figure 2-11 |
| Descending Diagonal Resistance | Reversal | Sell | Figure 2-12 |
| Descending Diagonal Resistance | Breakout | Buy | Figure 2-13 |
Table 2-3: List of support and resistance patterns.
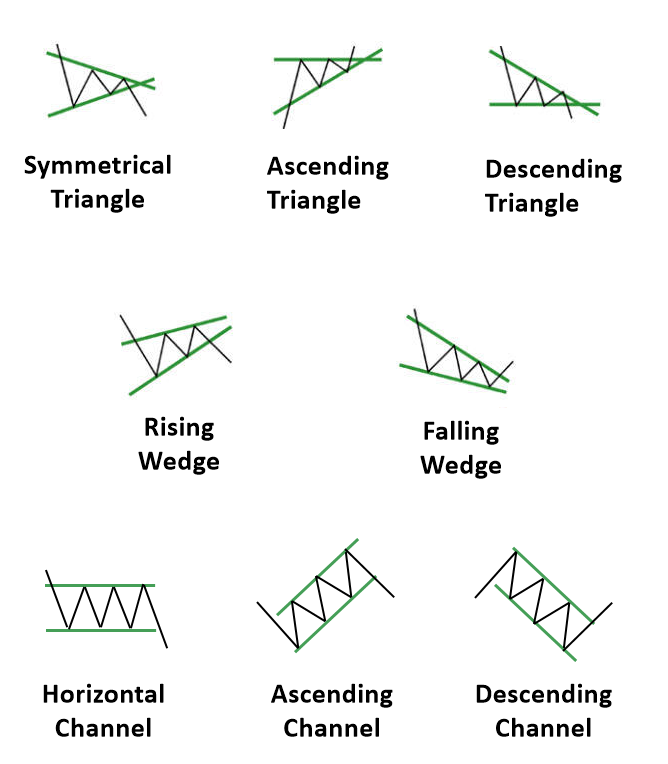
Figure 2-16: List of Triangle, Wedge, and Channel patterns.
| Triangle, Wedge and Channel Pattern | Sub Price Patterns |
| Symmetrical Triangle | Ascending Diagonal Support + Descending Diagonal Resistance |
| Ascending Triangle | Horizontal Resistance + Ascending Diagonal Support |
| Descending Triangle | Horizontal Support + Descending Diagonal Resistance |
| Rising Wedge | Ascending Diagonal Resistance + Ascending Diagonal Support |
| Falling Wedge | Descending Diagonal Resistance + Descending Diagonal Resistance |
| Horizontal Channel | Horizontal Resistance + Horizontal Support |
| Ascending Channel | Ascending Diagonal Resistance + Ascending Diagonal Support |
| Descending Channel | Descending Diagonal Resistance + Descending Diagonal Resistance |
Table 2-4: List of Triangle and Wedge Patterns and their sub price patterns.
Horizontal and Diagonal Support Resistance Explained
In Forex trading, understanding and correctly identifying support and resistance levels is crucial for making informed trading decisions. These levels help traders anticipate where the price might encounter obstacles and potentially reverse or break through, influencing entry and exit points in trades. Support and resistance can be either horizontal or diagonal, each type playing a significant role in technical analysis.
1. Horizontal Support and Resistance
Horizontal support and resistance levels are the most common types used by traders. These levels are drawn across historical price points that have repeatedly acted as a barrier to price movement, either on the downside (support) or the upside (resistance).
Horizontal Support:
- Definition: A horizontal support level is a price level where the price tends to stop falling and reverse direction. It represents a concentration of buying interest strong enough to prevent the price from moving lower.
- Characteristics:
- Price Floor: Acts like a floor preventing the price from dropping further.
- Multiple Touches: The more times a price level is tested without being breached, the stronger it is considered as support.
- Psychological Levels: These are often found at round numbers (e.g., 1.2000 on the EUR/USD pair), which tend to be psychologically significant to traders.
Horizontal Resistance:
- Definition: A horizontal resistance level is a price level where the price tends to stop rising and reverse direction. It represents a concentration of selling interest strong enough to prevent the price from moving higher.
- Characteristics:
- Price Ceiling: Acts like a ceiling preventing the price from moving higher.
- Reversal Points: Like support, multiple touches at a resistance level without breaching it signify its strength.
- Psychological Resistance: Resistance levels can also be at psychological round numbers, often where traders set sell orders or take profits.
Trading Strategies with Horizontal Support and Resistance:
- Range Trading: In a ranging market where the price moves between horizontal support and resistance levels, traders can buy at support and sell at resistance.
- Breakout Trading: When the price breaks above a resistance level or below a support level, it can signal the start of a new trend. Traders might enter a position in the direction of the breakout.
- False Breakouts: Traders can also anticipate false breakouts where the price temporarily breaches support or resistance but then quickly returns, indicating a failed breakout and potential reversal.
2. Diagonal Support and Resistance
Diagonal support and resistance, often referred to as trendlines, are sloped lines that represent dynamic levels of support and resistance. Unlike horizontal levels that stay constant, diagonal lines move in the direction of the trend.
Diagonal Support (Uptrend Line):
- Definition: A diagonal support level is a sloping line that is drawn along a series of ascending lows in an uptrend. It acts as a support level where the price tends to bounce higher.
- Characteristics:
- Trend Indicator: Diagonal support indicates an uptrend, with higher lows suggesting increased buying interest at higher price levels over time.
- Line of Ascending Lows: Drawn by connecting at least two lows in an uptrend; more points of contact strengthen the trendline.
- Dynamic Support: As it slopes upwards, the support level rises over time, indicating bullish momentum.
Diagonal Resistance (Downtrend Line):
- Definition: A diagonal resistance level is a sloping line that is drawn along a series of descending highs in a downtrend. It acts as a resistance level where the price tends to reverse lower.
- Characteristics:
- Trend Indicator: Diagonal resistance indicates a downtrend, with lower highs suggesting decreased buying interest and increased selling pressure at lower price levels.
- Line of Descending Highs: Drawn by connecting at least two highs in a downtrend; more points of contact strengthen the trendline.
- Dynamic Resistance: As it slopes downwards, the resistance level falls over time, indicating bearish momentum.
Trading Strategies with Diagonal Support and Resistance:
- Trend Following: Traders might enter long positions when the price bounces off a diagonal support line in an uptrend, or enter short positions when the price reverses down from a diagonal resistance line in a downtrend.
- Breakout Strategy: A break above diagonal resistance in a downtrend or below diagonal support in an uptrend might indicate a trend reversal or acceleration.
- Retest Strategy: After a breakout of a diagonal trendline, the price often retests the trendline, now acting as a support or resistance. This can provide a secondary entry point for traders.
3. Combining Horizontal and Diagonal Support and Resistance
- Confluence Zones: When horizontal and diagonal support or resistance levels converge at a similar price point, it forms a confluence zone. These areas are considered stronger because they combine two different types of support/resistance, making them key levels to watch for potential reversals or breakouts.
- Example Strategy: If the price is near a horizontal support level that aligns with a diagonal support line (uptrend line), this could be a strong buying signal as it suggests a stronger support zone.
4. Practical Example: EUR/USD Analysis
Scenario:
- On the daily chart, EUR/USD is in an uptrend with higher highs and higher lows.
- Horizontal Support: At 1.1500, the price has historically bounced multiple times, forming strong support.
- Diagonal Support: An uptrend line can be drawn connecting the lows from the past three months.
Trading Strategy:
- Buy Entry: Place a buy order near the intersection of the horizontal support at 1.1500 and the diagonal uptrend line, anticipating a bounce.
- Stop-Loss: Set a stop-loss slightly below the uptrend line to protect against a breakdown of the trend.
- Take Profit: Place a take-profit order at a level where historical horizontal resistance has formed, or slightly below the recent swing high.
Conclusion
Understanding both horizontal and diagonal support and resistance is vital for Forex traders. Horizontal levels provide clear, fixed price points where reversals or breakouts might occur, while diagonal levels indicate dynamic price changes that align with the prevailing trend. By combining these levels, traders can develop robust strategies to navigate the complexities of the Forex market effectively.
About this Article
This article is the part taken from the draft version of the Book: Scientific Guide To Price Action and Pattern Trading (Wisdom of Trend, Cycle, and Fractal Wave). This article is only draft and it will be not updated to the completed version on the release of the book. However, this article will serve you to gather the important knowledge in financial trading. This article is also recommended to read before using Price Breakout Pattern Scanner, Advanced Price Pattern Scanner, Elliott Wave Trend, EFW Analytics and Harmonic Pattern Plus, which is available for MetaTrader 4 and MetaTrader 5 platform.
Below is the landing page for Price Breakout Pattern Scanner, Advanced Price Pattern Scanner, Elliott Wave Trend, EFW Analytics and Harmonic Pattern Plus. All these products are also available from www.mql5.com too.
https://algotrading-investment.com/portfolio-item/price-breakout-pattern-scanner/
https://algotrading-investment.com/portfolio-item/advanced-price-pattern-scanner/
https://algotrading-investment.com/portfolio-item/elliott-wave-trend/
https://algotrading-investment.com/portfolio-item/equilibrium-fractal-wave-analytics/
https://algotrading-investment.com/portfolio-item/harmonic-pattern-plus/
Related Products


