How to Ride the Price Swing or Fractal Wave in Forex – Must Read
In this short article, we will share some practical tips to ride the price swings (or Fractal wave) in Forex and Stock market. Please read this article for your own good as it does not cost you anything. Forex trading is basically the decision making process over the market entry and exit. The most important variable you need to watch is the price. You need to watch how the price evolves with time. Hence, we will share the best way to calculate the market timing.
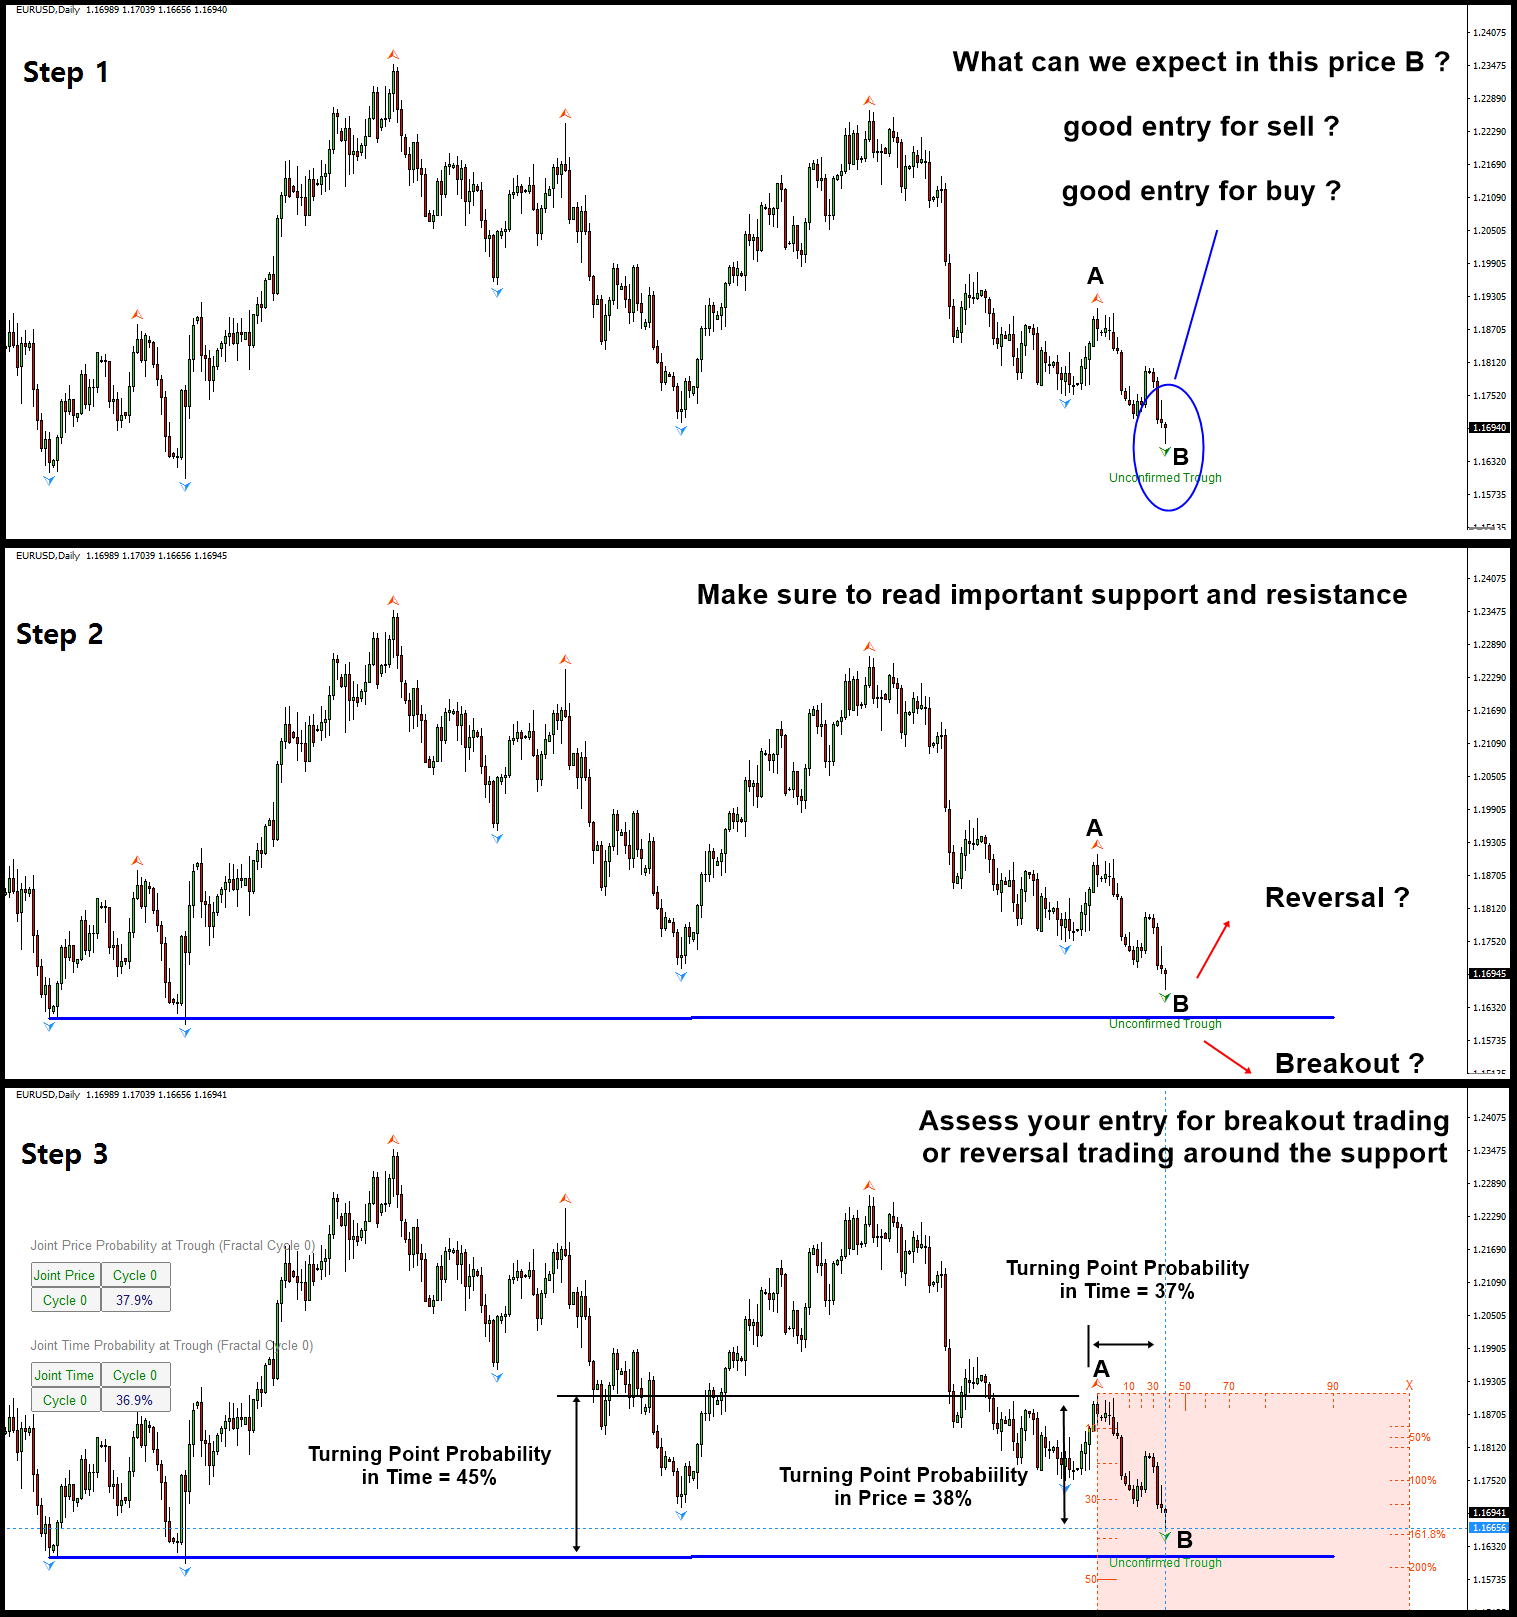
Step 1: open the chart. This is the first requirement for any trading. You need to see the price to learn what is going on in the market. Especially, when you apply the peak trough analysis in your chart, you will see lowest and highest points marked automatically. This lowest and highest points are basically the price swings happened in the past. You need use these price swings to read the market rhythm before making your trading decision.
Step 2: Look for the important horizontal support and resistance or diagonal support and resistance. In this example, we have drawn the horizontal support line for the visual illustration of this process. Marking up the support and resistance is simple task with peak trough analysis in your chart. Never underestimated them. It can takes as little time as 2 to 3 minutes to draw one or two important lines.
Step 3: Here is the most important part. As in our example, the price is heading to the horizontal support line, we need to assess how risky to take the reversal or breakout trading around this horizontal support line. Now we apply our turning point probability graph to assess our opportunity for reversal or breakout. Turning point probability will be measured between the point A and the point B. That is one price swing or fractal wave. Now let us have a look at the number.
From the turning point probability graph, at the point B, we can tell the followings:
- the turning point probability in price is 38%
- turning point probability in time is 37%
In another words, at the point B, we can tell the followings:
- the trend probability in price is 62% (1 – 38%)
- trend probability in time is 63% (1 – 37%)
Interpreting this probability, we can tell that the current price level is little bit immature to expect the reversal movement. If price go down further and it touches the horizontal support line, then we can tell the followings:
- the turning point probability in price is 45%
- turning point probability in time is unknown now. Depending on how fast or slowly price come down, it might go over 50%.
In Step 3 analysis, there are two important points for you to understand. Firstly, this trading opportunity is not entirely favoring the reversal trading. There are some cases which your chance for reversal trading is much higher comparing to the breakout trading chance. The step 3 analysis will usually help you to find out that. Secondly, since the certainty is not too high, this recommends you to position size carefully. In another words, you need to think about the mild position size rather than the big position size. Even more simply speaking, reduce the lot size for your forex trading. Then depending on the surrounding market condition, you can conditionally increase or reduce the position size. Checking the surrounding market condition is the final check up. If the surrounding market condition is not favoring your trading direction, it is good to skip this opportunity.
In long run, we recommend you to follow step 1, step 2 and step 3. Especially, step 3 is the most important analysis as you have the opportunity to access your risk in your trading. Typically, visualizing one’s trading decision is not an easy task. Hence, this article is not meant to provide the exhausted list of the analysis steps but use as only some base guideline. We hope you enjoy this short practical guideline. There are more educational articles in this link below.
- https://algotrading-investment.com/2019/07/23/trading-education/
- https://algotrading-investment.com/2020/04/26/metatrader-and-optimum-chart-manuals/
For the time being, there are only two tools that can measure the turning point probability in price and time. First one is the Fractal Pattern Scanner for MetaTrader 4 and MetaTrader 5. Second one is the Optimum Chart.
Below is the landing page for Fractal Pattern Scanner in MetaTrader version.
https://www.mql5.com/en/market/product/49170
https://www.mql5.com/en/market/product/49169
https://algotrading-investment.com/portfolio-item/fractal-pattern-scanner/
In addition, to accomplish this article. you can watch this YouTube video titled as “Breakout Trading vs Reversal Trading (Turn Support & Resistance to Killer Strategy)” in this link below to get some hands on practice with breakout and reversal trading opportunity with Support and Resistance Technical Analysis. In another words, you can turn simple support and resistance to the killer strategy for Forex trading.
YouTube Video Link: https://youtu.be/UbORmOacKIQ
Related Products


