How to Improve Supply and Demand Analysis
The supply and demand analysis does not require any complicated technical indicator and it bases its analysis mostly on the price itself. In fact, supply and demand analysis is another confirmative trading strategy that makes use of the fractal wave structure present in the forex and stock market. In another words, from the pattern identification to setting up the profit target and stop loss, the peak and trough play a crucial role. This characteristic is similar to other technical analysis mentioned earlier like the Support Resistance, Triangle pattern, Fibonacci Analysis, Harmonic Pattern, Elliott Wave pattern and X3 Chart Pattern. Hence, there are several ways to improve the supply and demand trading. In this book, we will show you one straightforward way to improve supply and demand analysis with the knowledge of fractal wave.
In the previous chapter, we have shown our trading examples using a virgin supply and demand zones. The virgin supply and demand zone refers to the zone that are not touched by price after the pattern was identified for our trading. We can improve the accuracy of this virgin supply and demand zone with the turning point probability. For example, when we trade with demand zone, we can ensure that the turning point probability is high at the location of the buy price. High turning point probability indicates the high chance for the price to turn. In another words, it indicates the high chance that the price approaching to the demand zone can rise soon. In the example for S&P 500 index, the price in its first touch of the demand zone was located around 70% turning point probability. In addition to the higher timeframe check-up, this turning point probability ensures that price is near the trough before going up.
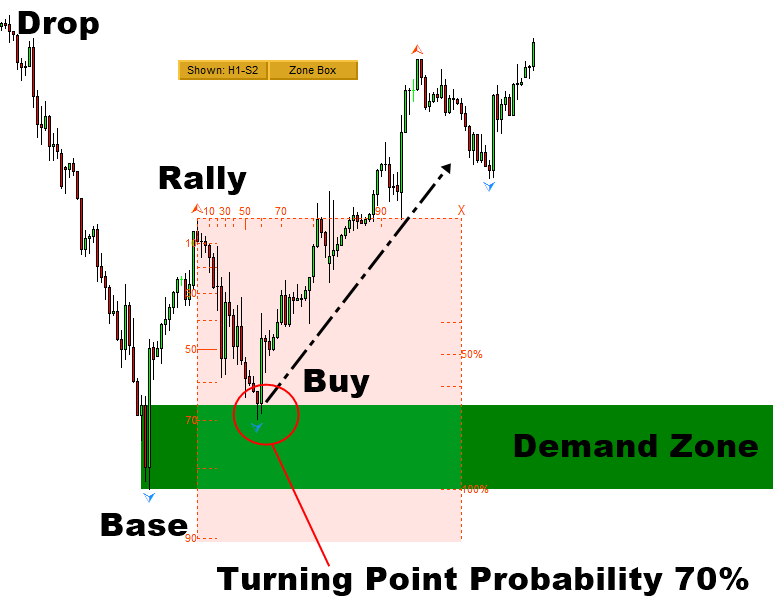
Figure 8-1: S&P 500 index H1 timeframe
Let us have a look at the supply zone trading example. In the example for Gold against US dollar, the price in its first touch of the demand zone was located around 50% turning point probability. Practically, it is recommended to confirm at least 50% turning point probability before making the buy or sell entry.
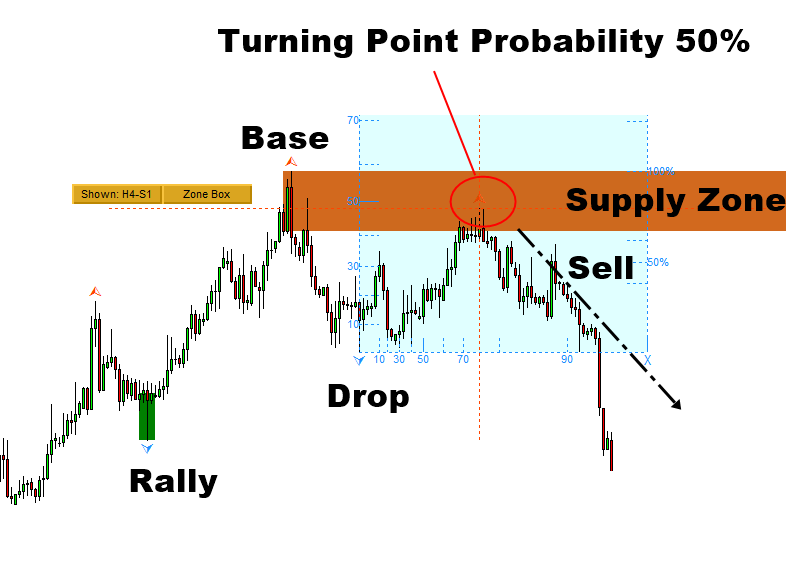
Figure 8-2: Gold against US Dollar (=XAUUSD) H4 timeframe (www.algotrading-investment.com)
The turning point probability helps us to do two things here. Firstly, it helps us to check the chance of getting the correct turning point after the price touches the zone. Secondly, it helps us to assess the curvature of the price path before it touches the zone. The curvature of the price path is one of the key factor for the successful supply and demand zone identification as it ensures the clear rally and drop pattern around the zone.

Figure 8-3: Curvature marked in red for demand zone (top) and supply zone (bottom)
About this Article
This article is the part taken from the draft version of the Book: Technical Analysis in Forex and Stock Market (Supply Demand Analysis and Support Resistance). Full version of the book can be found from the link below:
https://algotrading-investment.com/portfolio-item/technical-analysis-in-forex-and-stock-market/
You can also use Ace Supply Demand Zone Indicator in MetaTrader to accomplish your technical analysis. Ace Supply Demand Zone indicator is non repainting and non lagging supply demand zone indicator with a lot of powerful features built on.
https://www.mql5.com/en/market/product/40076
https://www.mql5.com/en/market/product/40075
https://algotrading-investment.com/portfolio-item/ace-supply-demand-zone/
Turning Point Probability and Trend Probability can be measured with Fractal Pattern Scanner at every price action in your chart. For your information, beside the probability check up, there are many other powerful features built inside the Fractal Pattern Scanner. Below is the landing page to Fractal Pattern Scanner in MetaTrader 4 and MetaTrader 5.
https://www.mql5.com/en/market/product/49170
https://www.mql5.com/en/market/product/49169
https://algotrading-investment.com/portfolio-item/fractal-pattern-scanner/
Related Products


