Trading Zone VS Support Resistance
In this article, we will compare the Trading Zone vs Support Resistance in terms of technical analysis used in Forex and Stock market. First of all, let us cover some basics of support and resistance. Support and resistance are the important technical analysis that help traders identify potential price movements to ensure picking up the right entry and exit points in the Forex market. Support Resistance are based on the idea that prices tend to bounce back or break through certain levels where the balance of supply and demand shifts. We provide the classic information on how support and resistance work. You will read this information in mind that we will introduce trading zone concept after.
- Support is a price level where the price tends to stop falling and reverse, because the demand is greater than the supply. Support indicates a concentration of buyers who are willing to buy at that level.
- Resistance is a price level where the price tends to stop rising and reverse, because the supply is greater than the demand. Resistance indicates a concentration of sellers who are willing to sell at that level.
- Support and resistance levels can be used to determine the overall trend and sentiment of the market, as well as the optimal time to enter or exit a trade. Traders can trade the bounce or the break of these levels, depending on their strategy and risk appetite.
- Support and resistance levels are dynamic and can change over time, depending on the market conditions and the trader’s perspective. Support Resistance can also be broken or violated, which can signal a continuation or reversal of the trend.
These four points are the some basis for support and resistance. Over years, we have done a lot of experiments in Forex and Stock market using the technical analysis. We found that support and resistance are the great tool but with one obvious disadvantage. The disadvantage is that levels or lines are difficult to manage the trading risk. When we think more than 50% of trading practice comes down to the risk management, the classic support and resistance might have some limitation.
Hence, trading zone in technical analysis is the extended concept to improve the classic support and resistance levels. The trading zone is the great tool to decide your trading entry and exit as well as managing your risk and reward. Deciding entry and exit with the trading zone is almost the same as using the support and resistance. Only difference is that they provide the sizable price range so that you can manage your entry and exit with your planned risk reward ratio. Trading zone is not new idea but this trading zone can improve your support and resistance trading. We strongly recommend to use the trading zone for your technical analysis.
Especially, when the trading zone is drawn around the significant peak and trough, the value for the trading zone is precious. When you use Harmonic Pattern or X3 Chart Pattern, the trading zone can be identified using the Pattern Completion Interval. The detailed process is well described in the Book: Guide to Precision Harmonic Pattern Trading (2016). When you use the supply demand analysis, the zone is identified from the base location. Especially, it is even better if the trading zone is non repainting. The non repainting zone become the powerful tool to decide the entry and exit for your trading because they stay in the location always as the reference.
https://play.google.com/store/books/details?id=8SbMDwAAQBAJ
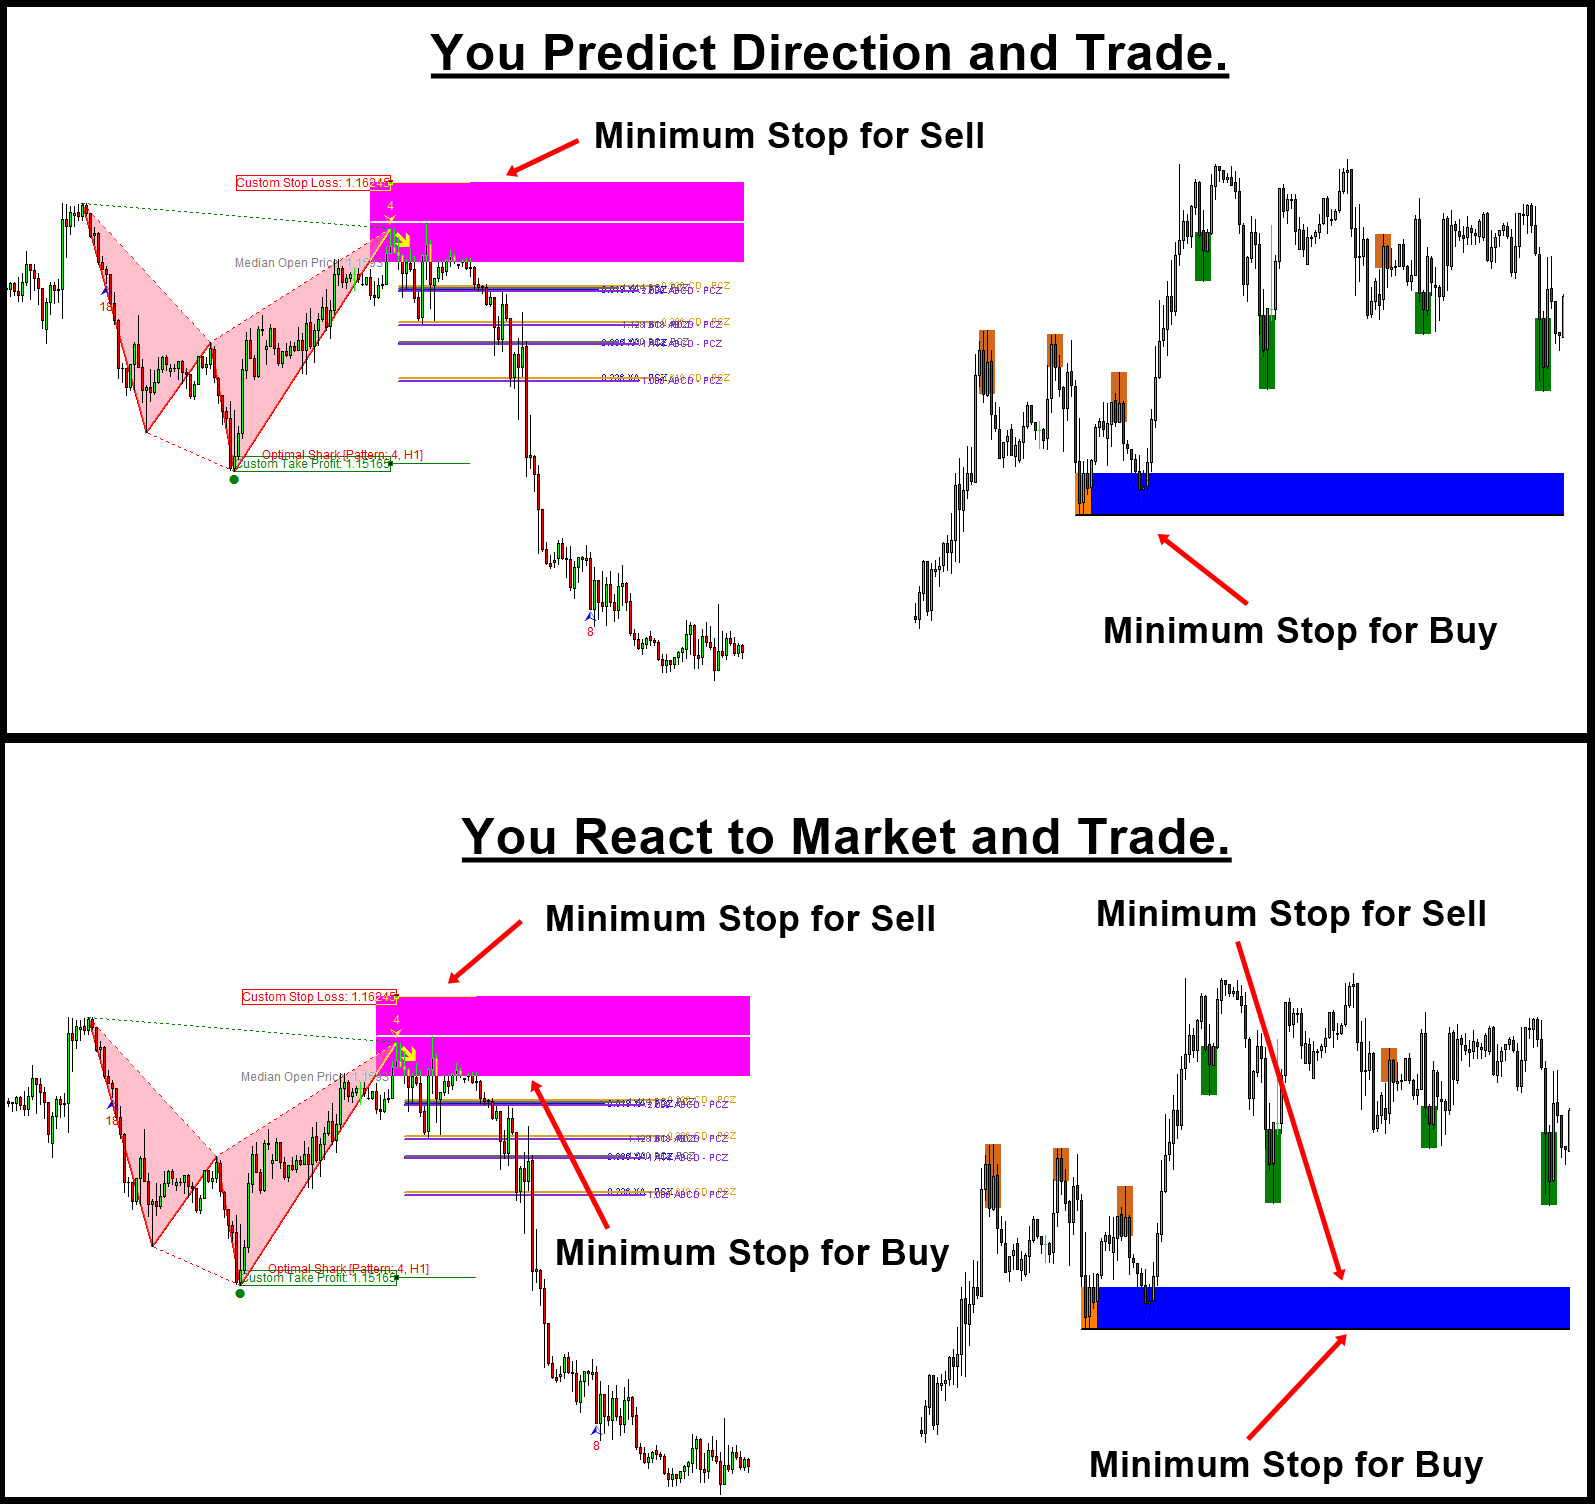
The trading zone is useful if your trading strategy is based on predicting the market direction. In such a case, the trading zone can provide a sensible place for stop loss. Then you can scale up your take profit target according to your anticipated location. Even if your trading strategy is not based on predicting market direction, the trading zone is still useful. For example, let’s say that you never want to predict the market, but you want to react the market so that you will trade in the direction in which the price is pushed by crowd like support and resistance style. In this case, the trading zone acts like the horizontal support resistance. But the managing your reward and risk is much easier than other mean of support and resistance.
I used the word minimum stop loss instead of the stop loss because sometimes, you might need to make your stop loss slightly bigger than the actual zone. The margin for the stop loss will be depending on your reward to risk ratio. How this reward to risk system works is well described in the latest book: Technical Analysis in Forex and Stock Market (2021).
https://play.google.com/store/books/details?id=pHlMEAAAQBAJ
For your information, we also provide the MetaTrader 4 and MetaTrader 5 indicators that provide the non repainting trading zone. You can have a look at these automated scanner, which you can trade with the direction prediction strategy as well as the react to market strategy.
Here is the link to Ace Supply Demand Zone Indicator for MetaTrader 4/MetaTrader 5.
https://www.mql5.com/en/market/product/40076
https://www.mql5.com/en/market/product/40075
https://algotrading-investment.com/portfolio-item/ace-supply-demand-zone/
Here is the link to X3 Chart Pattern Scanner for MetaTrader 4/ MetaTrader 5.
https://www.mql5.com/en/market/product/41993
https://www.mql5.com/en/market/product/41992
https://algotrading-investment.com/portfolio-item/profitable-pattern-scanner/
 The
The
Related Products


