Harmonic Pattern
Harmonic patterns are a set of a series of geometric price patterns used to identify potential reversal points and trend continuation in the market. Harmonic Pattern is a chart patterns used in Forex and Stock market including Butterfly, Gartley, Bat, Alternate Bat, AB=CD, Shark, Crab, Deep Crab, Cypher, 5-0 Patterns, 3 Drives Pattern and so on. Harmonic patterns are another fractal wave patterns that frequently used by many financial traders. Harmonic patterns are typically made up from two or three triangles (i.e. three price swings or four price swings). The structures of the harmonic pattern are based on the Fibonacci ratios. Hence, some people consider Harmonic pattern as an advanced Fibonacci price patterns.
The history of the harmonic pattern goes back to the Gartley’s book “Profits in the Stock Market” in 1935. At that time, Gartley described the trend reversal pattern on page 222 of his book. The pattern become popular in the late 1990s (Pesavento and Shapiro, 1997). Since then, many traders developed the common interest in looking for the repeating patterns in the financial markets. The harmonic patterns were refined many times in several decades. Harmonic trader emphasizes that the patterns are not only repeating in history but they also follow natural orders. Although few different references exist about the meaning of the natural orders, the natural orders mostly means the periods of the neighbouring waves in the Fibonacci relationship (Pesavento and Shapiro, 1997). Fibonacci ratio derived from Fibonacci numbers are the core relationship used in harmonic pattern identification. Then Scott Carney further expanded the theory and the patterns in his books on “Harmonic Trading”. After revised all the previous works in Harmonic Pattern and Chart Pattern, author “Young Ho Seo” created the mechanical rule that can formulate old and new Harmonic Patterns under one universal framework, called “X3 Chart Pattern”. That is to see the geometric price patterns using the building block of the triangle unlike the previous works were using lines and points to describe the geometric price patterns. The difference between these two approaches is that mechanical rule “X3 Chart Pattern” provides the easy way of testing and optimizing the geometric price pattern in the historical data, just like the shoes are manufactured by the machines accurately and repeatedly in the factory. You can check how to define the profitable pattern using the mechanical rule “X3 Chart Pattern” from the link below. Normally, Harmonic Pattern, Elliott Wave Pattern or other Chart Pattern can be defined using one or two short texts under the mechanical rule.
https://algotrading-investment.com/2019/07/09/defining-profitable-patterns/
https://algotrading-investment.com/2022/06/30/x3-chart-pattern/
Two main elements of Harmonic pattern trading are the pattern recognition and the market timing. Between those two elements, the pattern recognition is the prior task before the market timing. Mostly harmonic patterns consist of five points except few patterns. The five points are denoted as XABCD conventionally (Figure 1-2). Harmonic Pattern trading is the typical mean reversion trading strategy. It assumes that the market will change direction, for example, from buy to sell or from sell to buy. In fact, the harmonic pattern detection is equivalent to detecting the turning point. Although the accuracy of the turning point prediction is subject to the probabilistic nature, harmonic pattern trading is popular among traders.
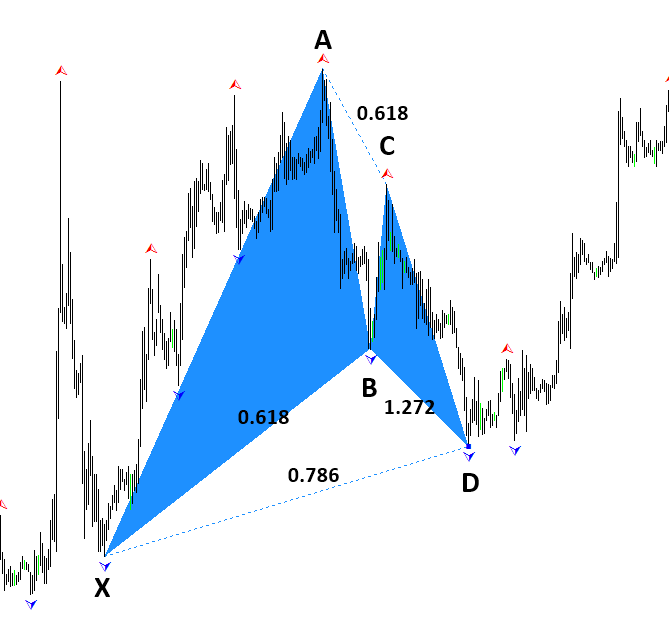
Gartley Pattern
Figure 1-2: Gartley Pattern detected by harmonic pattern scanner in Hourly EURUSD chart.
Harmonic Pattern Trading
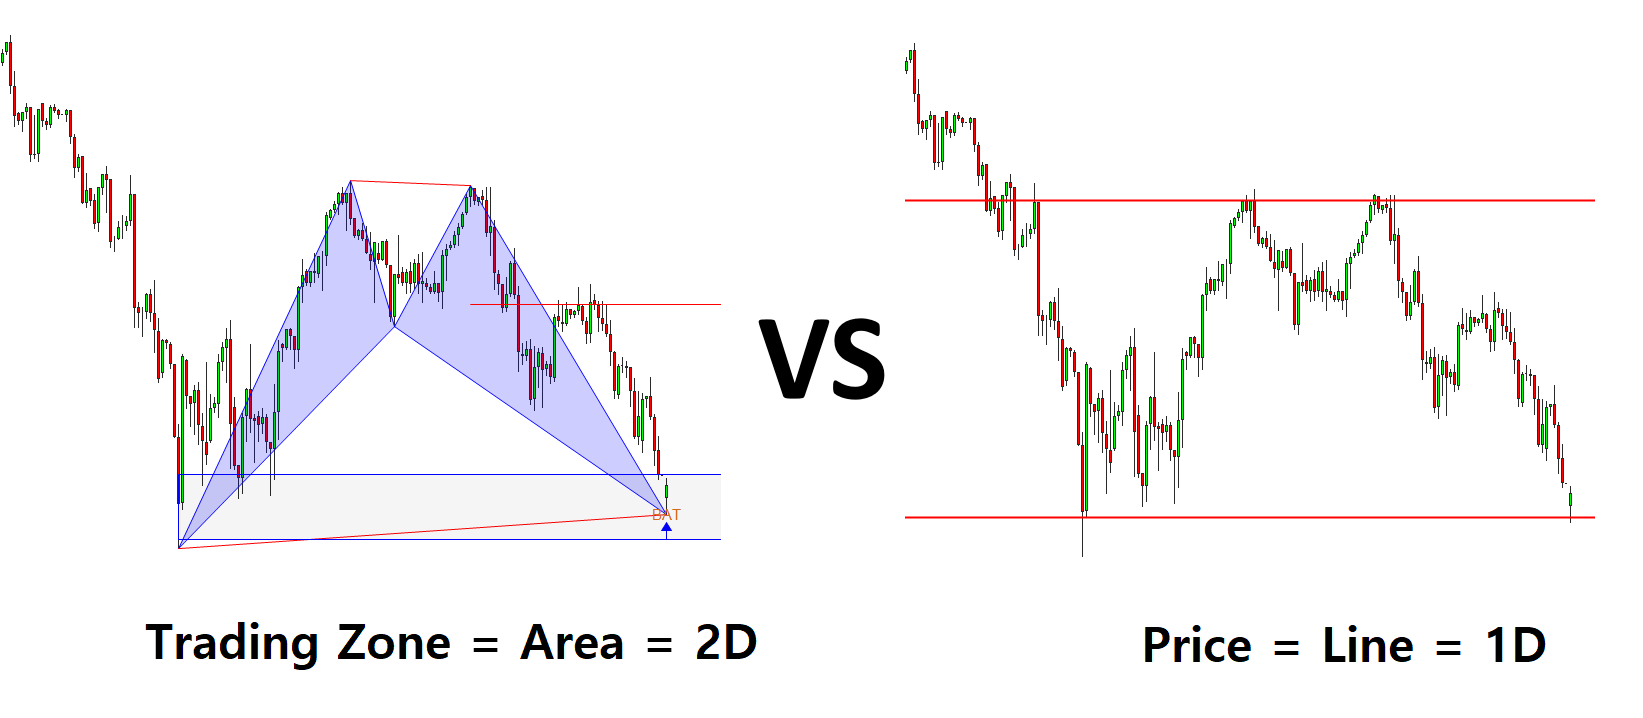
Harmonic Pattern can predict the turning point of the market. The advantage of Harmonic Pattern trading is a fast signal comparing to the general technical indicator based on averaging like the MACD and moving average indicator. Trading with Harmonic pattern might look sophisticated. However, if you compare the trading principle of Harmonic Pattern to Support and Resistance, you will find a shortcut to learn the trading principle. In another words, we can say that Harmonic Pattern trading shares some common background with the Price Action trading.
For example, the screenshot compares the pattern completion zone of bullish Harmonic Pattern to the support line in the identical chart. By looking at this screenshot, you have already understood great deal of information regards to the Harmonic Pattern trading. Pattern completion zone is a area (=2 Dimensional) where as the support is a price level (=1 Dimensional). Trading with Harmonic Pattern is about capturing the start of trend movement around this trading zone (=pattern completion zone). Trading zone helps you to identify entry and exit. Trading zone is also helpful to manage your take profit and stop loss. In practice, the trader never use the chart pattern alone to trade. To improve trading performance with Harmonic Pattern, you need to watch out several points.
- Price movement around the Pattern Completion Zone (= Trading Zone) in the chart pattern
- Risk management around the Trading Zone. Look for the trading entry, where at least, Reward > Risk x 2
- Possibility for breakout trading around the trading zone (=use them as support and resistance)
- Look for continuation pattern vs reversal pattern
Of course, this points are only a brief guide for Harmonic Pattern trading. In the section below, we provide Harmonic Pattern Book to discuss how to increase the trading performance with Harmonic Pattern.
Harmonic Pattern Trading
Harmonic Pattern Book
We also provide the great book for Harmonic Pattern and Harmonic Pattern Trading. You can have a look at these Harmonic Pattern Books to learn how to best use Harmonic Pattern for your trading in Forex and Stock market. From these books, you will also find the X3 Chart Pattern framework that helps you to study, prove and improve Harmonic Pattern to maximize your trading performance.
Guide to Precision Harmonic Pattern Trading
Link: https://algotrading-investment.com/portfolio-item/guide-precision-harmonic-pattern-trading/
Science Of Support, Resistance, Fibonacci Analysis and Harmonic Pattern
Profitable Chart Patterns in Forex and Stock Market
Harmonic Pattern Detection
Manual detection of Harmonic Pattern is a tedious task. Most of traders use Harmonic Pattern Indicator or Harmonic Pattern Scanner, which uses automated algorithm to detect Harmonic Patterns. Each Harmonic Pattern Indicator and Harmonic Pattern Scanner have differnt attributes. The important point about Harmonic Pattern detection is that there is a trade off between fast signal and repainting. Here we list four types of Harmonic Pattern Detection for your information.
Type 1: Non lagging (fast signal) but repainting
option to enter from turning point. Indicator does not show the failed pattern in chart and last pattern can repaint. This is almost considered as standard Harmonic Pattern Indicator. Even if they are repainting, harmonic pattern trader just accept it as it is. 99% of time, this is the harmonic pattern product you will get from the market whether they are free or paid one. You can trade live with this indicators but historical patterns can not be used to fine tune your strategy.
Harmonic pattern plus is type 1 Harmonic Pattern Indicator. It is extremely good product for the price. With dozens of powerful features including Pattern Completion Interval, Potential Reversal Zone, Potential Continuation Zone, Automatic Stop loss and take profit sizing. This is type 1 harmonic pattern indicator and cost effective harmonic pattern indicator.
https://www.mql5.com/en/market/product/4488
https://www.mql5.com/en/market/product/4475
https://algotrading-investment.com/portfolio-item/harmonic-pattern-plus/
Type 2: Lagging (slow signal) but non repainting
no option to enter at turning point (i.e. early signal). This type of indicator turns harmonic pattern indicator as slow as moving average cross over. It might be not overly attractive option for your trading. Indicator does not show the failed pattern. Hence, you can not use historical patterns to tune your strategy but last pattern does not repaint. You can trade live with this indicators but historical patterns can not be used to fine tune your strategy. Probably about 1% of harmonic pattern indicator is this type.
Type 3: Detecting pattern at point C but repainting
option to enter at turning point. Indicator detect pattern too early and you have to wait quite bit of time until price move near the point D. In fact, price may not move near point D. You might just waste your time waiting for the pattern. Indicator does not show the failed pattern and last pattern can repaint. You can trade live with this indicators but historical patterns can not be used to fine tune your strategy. Probably about 1% of harmonic pattern indicator is this type.
Harmonic Pattern Scenario Planner can be used like type 1 or type 3 Harmonic Pattern Detector. With additional features of predicting future harmonic patterns, this is very tactical harmonic pattern indicator with advanced simulation capability on top of the powerful features of harmonic pattern plus. This is cost effective Harmonic Pattern Detection indicator too.
https://www.mql5.com/en/market/product/6101
https://www.mql5.com/en/market/product/6240
https://algotrading-investment.com/portfolio-item/harmonic-pattern-scenario-planner/
Type 4: Non lagging (fast signal) and non repainting
option to enter from turning point. At the same time, the pattern is not repainting. This is hybrid of all above three system and can be considered as the most powerful harmonic pattern indicator. You can trade live with this indicators and you can also use historical patterns to fine tune your strategy. With this indicator, you are complying perfectly with the statement “Trade What you See”.
X3 Chart Pattern Scanner is type 4 Harmonic Pattern Indicator, which can be considered as the hybrid of type 1, type 2 and type 3. With non repainting and non lagging algorithm, this tool can detect with Harmonic Pattern, Elliott Wave Pattern, X3 Pattern structure for your trading. As a bonus, it provides your Japanese candlestick patterns too. X3 Chart Pattern Scanner is type 4 harmonic pattern indicator, which means that you can fine tune your strategy using historical patterns while you are trading the same patterns on live trading.
https://www.mql5.com/en/market/product/41993
https://www.mql5.com/en/market/product/41992
https://algotrading-investment.com/portfolio-item/profitable-pattern-scanner/
Harmonic Pattern Testing
For your trading in Forex and Stock market, we provide the detailed performance for each Harmonic Pattern. You can download PDF file for each pattern from the link below. Or you can visit the YouTube video to check each pattern from the link below. Each PDF or YouTube video will provide you a proof for the Harmonic Pattern. At the same time, you can use this proof to improve the given structure of the Harmonic Pattern. Of course, it is possible to test more Harmonic Patterns to trade than those shown here. You can test other Harmonic Pattern using X3 Chart Pattern framework too. After that, if you want to keep the Harmonic Pattern structure only for yourself to trade and to make money, then it is fine. However, if you want to share the information with public for the scientific record, then you can send us the testing results too. We will publish them here for you in our website. More testing results of Harmonic Pattern will come in the future from us too.
From the link below, you can find the useful information for Gartley Pattern used in Forex and Stock market.
Gartley Pattern: https://algotrading-investment.com/2022/05/18/gartley-pattern-harmonic-pattern/
From the link below, you can find the useful information for Butterfly Pattern used in Forex and Stock market.
Butterfly Pattern: https://algotrading-investment.com/2022/06/20/butterfly-pattern-harmonic-pattern/
From the link below, you can find the useful information for Bat Pattern used in Forex and Stock market.
Bat Pattern: https://algotrading-investment.com/2022/06/21/bat-pattern-harmonic-pattern/
Harmonic Pattern Structure
Harmonic Pattern is based on Fibonacci ratio. Each Harmonic Pattern has unique structure. The structure of Harmonic Pattern usually refers to the ratio of the pattern. Some text book introduce the ratio of Harmonic Pattern. However, each ratio in a Harmonic Pattern can be tuned, modified or improved to fit for your trading style. Typically, Harmonic Pattern consists of 4 or 5 points in chart. Harmonic Pattern with 4 points consists of two fractal triangles. AB=CD pattern is a good example of 4 points Harmonic Pattern. Harmonic pattern with 5 points consists of three fractal triangles. Gartley and Butterfly patterns are the good example of 5 points Harmonic Pattern. We have made some screenshots of each Harmonic Pattern. Please have a look at these screenshots to accomplish your understanding of Harmonic Pattern.


Related Products


