Mother Wave and Child Wave
In financial trading, interpreting the Fractal Patterns constitute of Mother Wave and Child Wave can provide the unmatched beneifit for buy and sell decision making. Hence, it is important to understand the concept of Mother wave and Child Wave in the price chart. Simply speaking, Mother wave is the bigger wave which is made up from several small waves, child waves. For example, in the figure below, I have highlighted peak – trough – peak using borders for Mother wave. You can readily count how many child waves are inside this big mother wave. There are seven child waves inside the mother wave. This is only conceptual drawing for mother wave and child wave. In fact, we can have any number of child waves inside mother wave. For example, three child waves inside one mother wave is common structure in Harmonic Pattern and X3 Pattern. Remember that drawing is only generic illustration of mother wave and child wave concept. Anyway, this is not a new concept. Elliott Wave Theory, Harmonic Pattern and X3 Pattern utilize the concept of Mother and Child wave in their pattern identification exercise. However, here is something you have to understand for your trading. In Elliott Wave, Harmonic Pattern and X3 pattern, the ratio between the mother wave and child wave matters. As I mentioned before, this is the relative term of our prediction equation for Forex and Stock market. For the good prediction, we need both relative term and absolute term in our prediction equation.
The “pattern inside pattern” analysis (PPA) often reveals the most efficient entry for our trading. This was the third important guideline we have learned from the fractal wave analysis. This is probabily the most important guideline for the practical trading. When small triangles make up the large triangle in the fractal wave, we can call the small triangle as the child wave and the large triangle as the mother wave. For example, in the large cycle, price could make a swing high by moving 1000 points up from trough to peak. The swing high of the large cycle is made up from many small price swings in the small cycle. More precisely, the swing high of the large cycle is made up from the triangle 3, 4 5 and 6 in the small cycle. Likewise, in the large cycle, price could make swing low by moving 600 points down from peak to trough. The swing low of the large cycle is made up from many small price swings in the small cycle. More precisely, the swing low of the large cycle is made up from the triangle 0 and 1 in the small cycle.
We can use the turning point probability to draw some efficient trading entry satisfying both mother wave (=large cycle) and child wave (=small cycle). Although it might look more complicated, this still follows the basic guideline, to look for the turning point in high probability area and to look for the breakout in low probability area. When we want to trade with the turning point, there are two things to check up. Firstly, we need to check the high probability in the mother wave, say over 80%. Secondly, we need to check the Fibonacci expansion in the child wave. Basically, we are trying to find the turning point in which satisfies both mother wave and child wave.
The chart below presents the bullish turning point example of the mother wave pattern with eight child waves in the swing low. Initially, this price pattern was detected at 80% turning point probability of the mother wave. Then we used the Fibonacci expansion for the fine tune of the entry. The size of first triangle was around 10% (=left axis) in the large cycle. Hence, we were anticipating bit wider range of Fibonacci expansion ratios from 2.618 to 5.000. The actual turning point was taken at the Fibonacci expansion 3.148 ratio. The final turning point was made around 88% and 95% probability respectively in price and time.
The chart below presents the bearish turning point example of the mother wave pattern with four child waves in the swing high. The turning point probability of mother wave was 85%. The Fibonacci expansion 1.618 of the child wave was coincided at the high probability in the mother wave. Hence, the Fibonacci expansion 1.618 provides the good bearish turning point entry. We can also detect the breakout trading opportunity with mother wave and child wave pattern. Breakout refers to the strong price movement in one direction. To detect the breakout opportunity with mother wave and child wave pattern, there are two things to check up. Firstly, we need to check the low turning point probability in the mother wave. Secondly, we need to check if price penetrates the child wave. For example, the chart presents an example of mother wave detected at 32.8%. The example shows the bullish breakout. In the swing high of the mother wave, it is still infantry but we can observe two child waves. Once the price penetrates the breakout level, price can continue to make the bullish movement.
Here is another chart with an example of mother wave detected at 6%. The example shows the bearish breakout. In the swing low of the mother wave, it is still infantry but we can observe two child waves. Once the price penetrates the breakout level, price can continue to make the bearish movement. The turning point probability presents the quantified prediction to time the arrival of the new turning point. As it is purely developed in the geometric dimension, the turning point probability can be combined well with any existing technical analysis. It is possible to perform both reversal and breakout trading. The reversal trading and the breakout trading are the two important logics for the day trading. Some people are good at breakout trading whereas some people are good at reversal trading. Until you try both, you will never know which one you are good at. Our recommendation is to stick with what you are good at first. Once you have mastered one strategy, then you can move on to another one.
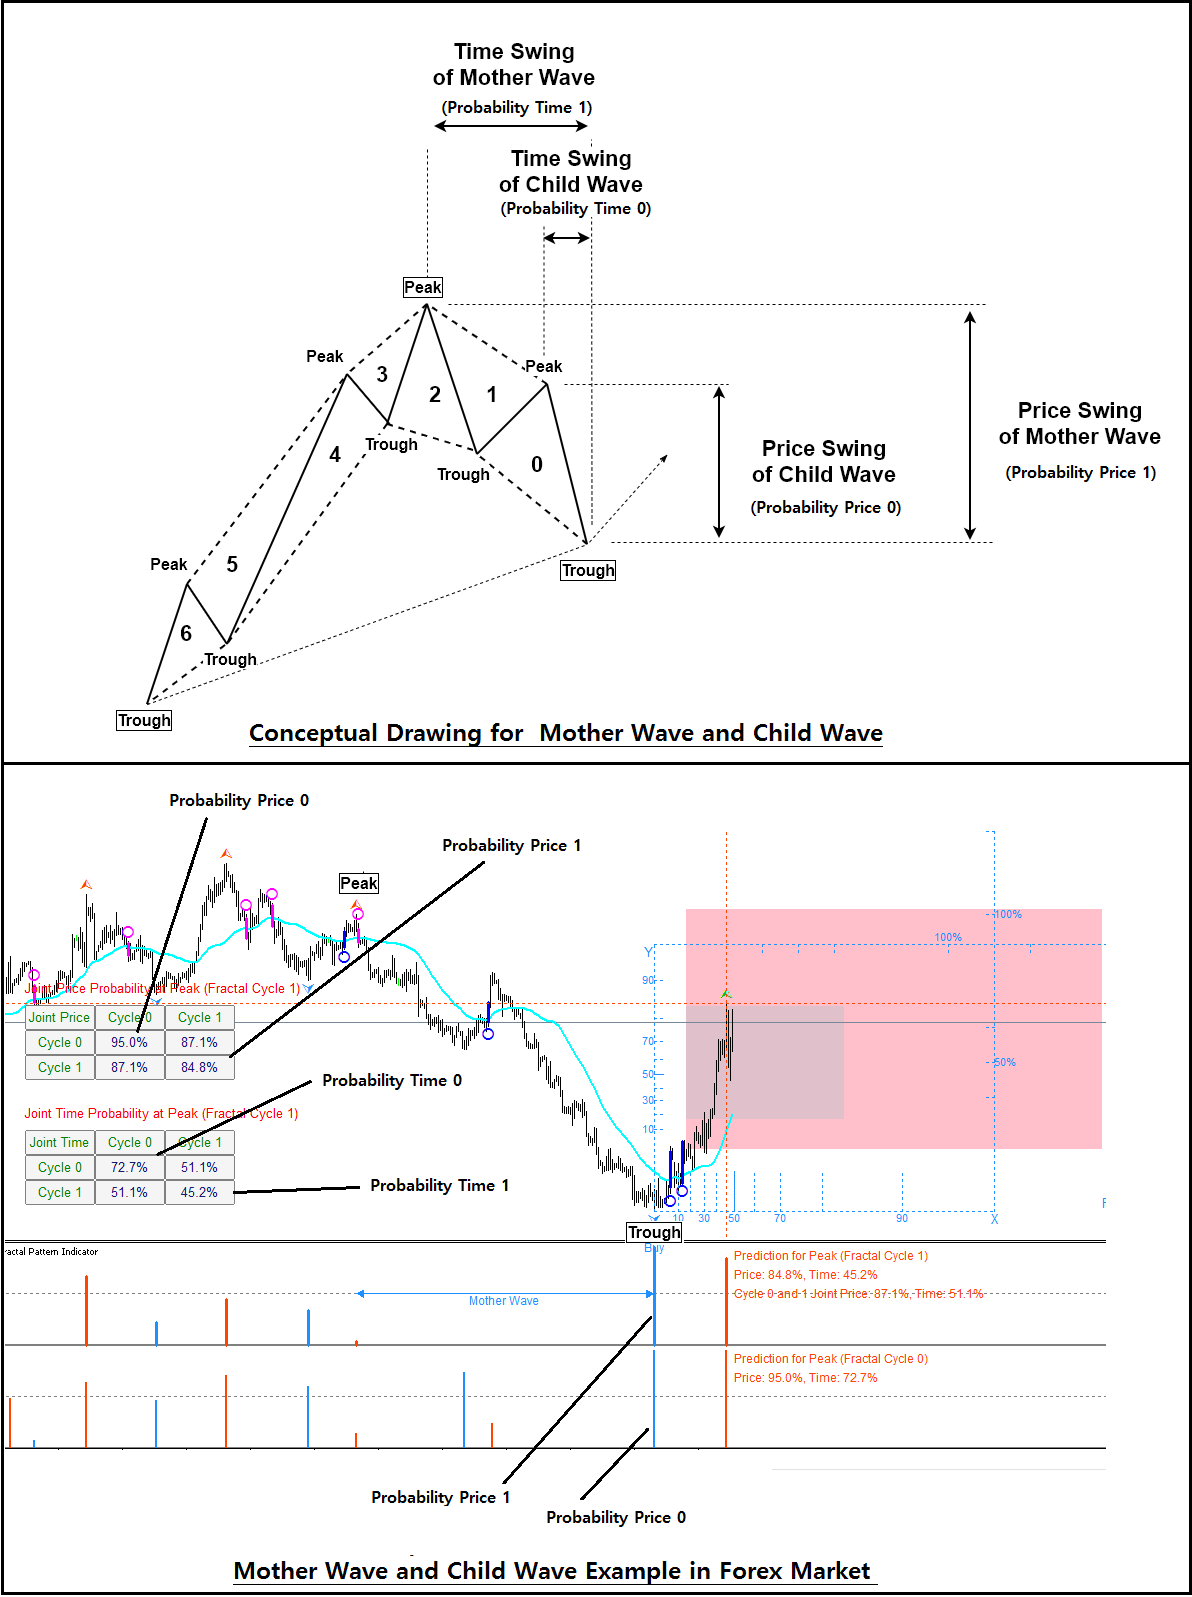
For the absolute term, we use turning point probability of both mother wave and last child wave. We can use the turning point probability in price and time. To help you understand these concept easy, I have shown the practical example of mother wave and child wave in EURUSD H4 timeframe. I have made the conceptual drawing and practical example for cross referencing.
Here is what you should check in the top and bottom of screenshot.
- Location of bordered trough – peak – trough
- Location of Probability Price 0
- Location of Probability Price 1
- Location of Probability Time 0
- Location of Probability Time 1
When you scan through above five points, you should be able to understand the concept of absolute and relative terms as well as the concept of mother wave and child wave.
These turning point probability for both price and time are calculated for your trading in Fractal Pattern Scanner. You might be wondering what is the probability in the diagonal boxes. They are called Joint Probability. However, this is more advanced concept. Hence, we will not explain these joint probability here. But you can google for sure. These probabilities are the absolute part of information and you should make use of them together with relative part of information, the ratio structure of patterns.
The screenshot attached has all the important information for your understanding. Give some time to understand them.
Below is the download link for Fractal Pattern Scanner.
https://www.mql5.com/en/market/product/49170
https://www.mql5.com/en/market/product/49169
https://algotrading-investment.com/portfolio-item/fractal-pattern-scanner/
In fact, if you have not done the training with Peak Trough Analysis, you should and you must do. Otherwise, it is difficult to understand the patterns in the financial market. If you want to become successful trader, then you need to understand patterns in the financial market. That is for sure. Here is the download link for Peak Trough Analysis. We provide this indicator for free to educate people. You can also use Peak Trough Analysis indicator for your practical trading too because there are many traders are using them in real world trading.
- https://www.mql5.com/en/market/product/23797
- https://www.mql5.com/en/market/product/22420
- https://algotrading-investment.com/portfolio-item/peak-trough-analysis-tool/
Related Products


