Chart Pattern in Forex and Stock Market
Chart Patterns are an important aspect of technical analysis in Forex and Stock market. Chart Patterns are formed by price movements and they can provide insights into the future direction of currency pairs. There are many different types of chart patterns, but some of the most commonly used ones include head and shoulders, double and triple tops and bottoms, Elliott Wave, Harmonic Pattern, X3 Chart Pattern. These chart patterns can be applied to different types of charts such as line chart, bar chart, and candlestick chart.
For example, a head and shoulders pattern is formed when the price of a currency pair rises to a peak and then falls back, followed by a higher peak and then another fall back to the same level as the first fall. This creates a pattern that looks like a head with two shoulders. The pattern is considered complete when the price falls below the support level, which is the line connecting the two lows of the pattern.
Another example is the double top pattern, which is formed when the price of a currency pair rises to a peak, falls back, rises again to the same peak, and then falls back again. This creates a pattern that looks like two peaks at the same level. The pattern is considered complete when the price falls below the support level, which is the line connecting the two lows of the pattern.
Learning to recognize these chart patterns and their meanings is an essential part of the day trading. In this article, we will cover some basics of chart patterns to help you to understand them and to use them better.
1. Introduction to Chart Pattern
Learning the geometric shape of the chart patterns might be not sufficient to apply them well in the financial market. If we understand why the chart patterns exist in the financial market, we can use them more accurately. Hence, it is important to understand the underlying science behind the chart patterns. In doing so, we need to understand the trend and cycle. Then we need to see the connection of fractal wave with trend and cycle. Finally, when we recognize the fractal wave as the superior analytical method to the existing methods, we will understand why chart patterns were used in the financial market over 100 years.
2. Trend
Trend is the movement of the price in one direction. Trend is the direct representation of the supply demand balance in the financial market. In terms of economics, trend is one of the force moving the price to release the unbalance between supply and demand. Assuming there is the fixed number of shares for Google, if more people want to buy a stock than sell it, then the share price for Google will move up. We call this as a bullish trend. Likewise, if more people want to sell a stock than buy it, there would be greater supply than demand and the price would fall. We call this as a bearish trend. When there is the imbalance between supply and demand, then the price tends to move towards the equilibrium to release the imbalance. The supply demand imbalance is often caused by many different reasons. For example, change in the taxation or interest rate can change the supply and demand force dramatically. Natural disasters like Earthquake or Hurricanes or other serious transmissible diseases can influence the dynamics of supply demand too in the financial markets. War, terror, or other political corruption can reduce the demand of the financial assets affected by them.
There are different types of trend. They might be linear trend like Pattern (2, 1) or they might be nonlinear trend like Pattern (3, 1) and (4, 1). The three trend patterns, that are linear, exponential and damped, are common. Exponential trend (3, 1) represents the strong trend with increasing momentum. Damped trend (4, 1) represents the trend with reducing momentum. These six trend patterns are found most frequently in the financial market.
In reality, trend can be stimulated by multiple information sources introduced in different time. Each information source will be diffusing across the market in different time. Some of them are slowly and some of them are quickly. Some information source will introduce bullish trend, which increase demand and reduce supply. Some other information source will introduce bearish trend, which reduce demand and increase supply. In practice, situation is tougher because we will have many financial and political news released in 24/7 days. Hence, we have to deal with the collection of trends instead of one trend in the financial market. Some trends will be cancelled off each other and some trends will be adding up to form the bigger trend. As a result, sometimes, this collective trend can have a clear direction. However, sometimes, we may not see clear direction from this collective trend but just ranging movement. At the same time, we could have many short-lived trends too.
3. Cycle
If price shows the trend behaviour only, then the financial trading could have been much easier. There are numerous methods that can predict the purely trending price series. Technical analysis, Statistics, and Time series forecasting provides such methods. In reality, however, we often see seasonal or more complex cyclic patterns beside the trend pattern. Cycle like trend is another dominating pattern existing in our world. Especially, when the data shows both trend and cycle behaviour together, they show more complex behaviour. Seasonal or cyclic patterns are similar to the concept of wave in Physics. To predict the cyclic patterns, we need to have two quantities including wavelength and amplitude. Wavelength is the distance from any point on one wave to the same point on the next wave along. Amplitude is the height of wave from the top of a crest to the centre line of the wave.
In the textbook, they teach the simple wave pattern like a sine or cosine wave. However, it is hard to see the real world market data behaving like the simple wave pattern. In the real world, the data often show the wave patterns made up from multiple cyclic components with different properties. Typically, it is hard to recognize this sort of complex cycle pattern in data without using any tools. Scientist uses various analytical methods to understand this sort of complex cycle pattern like Fourier transform, Principal Component Analysis, Wavelet transformation and so on.
In time series analysis, they developed the technique to extract the seasonal fluctuations in data. They use the seasonal exponential smoothing or Seasonal ARIMA model to predict the cyclic patterns in the data. In addition, some researchers created some statistical model to understand the seasonal fluctuation in S&P 500 index. The weak seasonality might be observable in S&P 500 index. However, it should be noted that the weak seasonality might be not too useful for our trading. Therefore, this conclusion should be not hastily applied to other data, which is not S&P 500 index.
When we combine trend and cycle, we can create some interesting price pattern table to understand the data. For example, the four trend patterns, including constant trend, linear trend, exponential trend and damped trend, can be combined with cycle to create twelve price patterns. These twelve price patterns are for the case of bullish trend. Another twelve price patterns can be created for the case of bearish trend too. Therefore, trend and cycle can produce 24 variations of the price pattern. In fact, this table was created by Everette Gardner in 1987. At the moment, Everette Gardner is one of the most influencing researcher in the field of time series analysis. You might come across this table if you are the business analyst or forecasting analyst in the industry.
Now let us try to understand the price pattern table for the case of bullish trend. In the first column, we see the pure trend pattern. In the second column, we see the combined pattern of the trend and additive seasonality. The additive seasonality is the seasonal fluctuation with constant amplitude. In the third column, we see the combined pattern of the trend and multiplicative seasonality. The multiplicative seasonality is the seasonal fluctuation with increasing amplitude. Firstly, creating the price pattern table helps us to choose the right analytical methods depending on the data type. Secondly, the table helps us to make a logical decision quickly when our prediction did not go as it was planned.
This sort of trend and cycle prediction works well on some data in business and economics. However, trend and cycle model might impose some limitations when we want to predict the financial market data. It is because it is hard to pin down the wavelength of cyclic pattern for the price series in Forex and Stock market. For example, the number of air passengers are often affected by weather condition, the data will show some clear seasonal fluctuation. In addition, usage of air conditioner and heater are highly correlated to the change in temperature, therefore, electricity or natural gas consumption for the households in the city can be predicted well with the trend and cycle. However, the financial market is affected by too many variables. The temperature and weather condition are only one of many. Instead of trying to determine the wavelength and amplitude of the cyclic pattern, it is wiser to catch the market rhythm, which is sometimes slow or sometimes fast. One of the most prominent method of catching market rhythm in the financial market is using fractal wave. To understand fractal wave, we first need to understand the concept of fractal. Hence, in the next few chapter, we will explain fractal and fractal wave in detail. This will provide the scientific rational before we understand the important price patterns used in the financial trading last 100 years.
4. Fractal
When the same or similar geometric shape is repeating infinitely in different scales, we call it “Fractal”. The self-similarity is the typical property of fractal. Fractal can be observed everywhere in the universe. In the space, tree, human anatomy, mountain, and, coast, we can observe fractal. For example, in the Romanesco Broccoli, the smaller piece, if they are broken off from the bigger piece, do look like the big piece. Like this, in Fractal, the same or similar patterns are occupying the entire structure of an object.
Another example of fractal in nature is a coastline. The coastline shows the similar details on different scales. The waves provide a steady force to shape the coastline over time. When the coastline is straighter, the waves will keep pounding until they become more fractal. This mechanism cut the straighter line of coastline more wobbly in the zigzag pattern. Then, the straighter line inside the zigzag line will be cut into the smaller zigzag pattern. As a result, the coastline will look similar whether you zoom in or zoom out in the map.
If you still found it difficult to understand fractal, then let us introduce more straightforward example. For example, Sierpinski triangle is good example of self-similarity and fractal. Sierpinski triangle is made up from identical shape, the triangle. In Sierpinski triangle, the triangle is continuously expanding to build the bigger triangle. As we magnify any part of Sierpinski triangle, we see the identical triangles. Hence, Sierpinski triangle is one of the good example to explain fractal.
Beside Sierpinski triangle, snowflake, heartbeat rate, structure of brain and, internal organs are another examples of fractal too. Fractals can be classified into few different types depending on the degree of the self-similarity. For example, when the repeating geometry is strictly identical like snowflake and Sierpinski triangle, we call them as the strict self-similarity. When the repeating geometry is similar but not identical like coastline and heartbeat rate, we call them as the loose self-similarity. This loose self-similarity is often referred to as the statistical self-similarity because we can observe the repetition in the degree of complexity within statistical range not the exact pattern.
Price data in the financial market represent fractal with the loose self-similarity. In “The Misbehavior of Markets: A Fractal View of Financial Turbulence”, Benoit Mandelbrot and Richard L. Hudson applied the fractal theory to understand the financial market. They explained that the financial market can impose a greater risk than it can be explained by the modern mathematical assumption. In addition, they believed that the financial market possess a memory. As a result, the similar events in the financial market can repeat in certain rhythm.
With the assumption that price continuously rises and falls, then the price can behave like fractal. Either we connect a peak, trough, and peak or we connect a trough, peak, and trough, it would form a triangle. Like other fractal object, the small triangles will form the bigger triangle. Eventually, the entire historical price would be described as one or two big triangles. The price data in the financial market possess the property of the loose self-similarity than the strict self-similarity. More precisely, since the price is recorded over time, we can call it as “Fractal Wave”.
When we describe the fractal object, there are three important characteristics. Especially, if you want to apply the price patterns in the financial market, then understanding these three characteristics are the key to the success.
• Fractal dimension index
• Scale
• Pattern inside pattern
Fractal dimension index is a measure of how much an N dimensional space is occupied by an object. The concept of fractal dimension is similar to the dimension in Physics. The first dimension is a line connecting two points. The second dimension is a plane or a surface with both length and width. In fractal dimension, we can get the dimension in fraction instead of the whole number.
For example, a straight line have dimension of 1 but a wiggly line has a dimension between 1 and 2. More precisely, their Fractal Dimension can be expressed as Log (N)/Log (r) where N = number of self-similar pieces and r = linear scale factor. Now to illustrate the concept, we will present the four cases from dimension 1 to 2. If we reduce size of straight line by linear scale factor r = 2, then then we get two self-similar piece, N = 2. Therefore, the dimension of the straight line is 1.
Likewise, if we remove the middle third of the straight line and replace it with two lines with the same length, then we get the first iteration of the Koch Curve. In this example, for the linear scale factor r = 3, we get the four self-similar pieces. Therefore, the dimension of Koch Curve is 1.26816 = Log (4) / Log (3).
Sierpinski Triangle is another example of Fractal Geometry. If we connect the mid points of the three side inside an equilateral triangle, then we get 3 equilateral triangles inside the first equilateral triangle. Note that we do not count the resulting upside down triangle as a self-similar piece. In this case, the linear scale factor r is 2 since generated triangle have the half of the width and height. The Fractal dimension D = 1.585 = Log (3)/ Log (2).
Finally consider a square. For the linear scale factor r = 2, we will get four squares inside the first one. Therefore, our fractal dimension for a square is D = 2 = Log (4) / Log (2). Even we make the linear scale factor r = 3, we still get the same Fractal dimension D = 2 = Log (9) / Log (3). As we have illustrated in the four examples, Fractal Dimension generalize the topological integer dimensions to a fraction. Higher the fractal dimension means that the fractal geometry to occupy more space in the dimension. Therefore, a square have the Fractal Dimension 2 as the smaller square fits larger one without leaving any empty space. If our fractal geometry is kept removing space, then we could get the Fractal Dimension less than 1 too.
Calculating the Fractal dimension index for Stock and Forex market data is more complicated than above examples. However, we can use the similar approach used to measure the fractal dimension index of the coastline by Benoit Mandelbrot. Benoit Mandelbrot calculated the fractal dimension index 1.7 for the cotton price in the commodity market. Valdez-Cepeda and Solano-Herrera (1999) calculated the fractal dimension index 1.332 for Dow Jones index and the fractal dimension index 1.688 for 30 German Stock index. Although each stock market data can have different fractal dimension index, we can guess that the fractal dimension index for each stock and forex market data will remain between 1 and 2. Benoit Mandelbrot mentioned that it is impossible to define the exact geometric shape from the fractal dimension index. However, it is possible to guess the coverage of the repeating patterns in the price data if we can calculate their fractal dimension index. Of course, we can use this knowledge as an advantage for our financial trading.
The second important characteristic in fractal is scale. When we connect three consecutive turning points in the chart, we can create one triangle. Then the several triangles can form a bigger triangle and so on. Eventually, the entire stock price or currency price can be described using one or two triangles. Even after the infinite amount time, this will hold true as long as the assumption that price will continuously fall and rise. This opens up one important question for our trading. What is the relationship between cycle and fractal? Or, what is the relationship between cycle and fractal wave?
If we can collect all the triangles in the price series in once place, then we can probably stack up all the triangles from smallest to largest. When infinite amount time passes, the amplitude of price can become infinite but maybe not. We can statistically guess the repeating geometric shape. However, we can not guess the amplitude of the price. Hence, if the price is fractal, then assumptions held from cycle is no longer applicable. For example, in the cycle, we assume that wavelength and amplitude are determined. When we can identify the wavelength and amplitude, we can predict or project the future movement of the price. However, if the price is fractal, then we can not predict or project the future price as we can not determine the wavelength and amplitude. In another words, fractal wave means the infinite number of cycles with different scale of wavelength and amplitude. For this reason, many existing mathematical methods might be not suitable to predict the price series in the financial market although they work well on other data. On the other hand, one of the best method to predict the price in the financial market is using the price patterns. Since using the price patterns does not require to know the amplitude of the price, they are naturally the most efficient method to predict the price in the financial market.
The third important characteristic is “pattern inside pattern”. We already know that small patterns make up the bigger pattern in fractal. When we trade, sometimes, we have to see both small pattern and bigger pattern together. Especially, more advanced pattern analysis like Harmonic Pattern, Elliott Wave Theory and X3 Chart Pattern often involve “pattern inside pattern” analysis (PPA). When we compare cycle and fractal wave in analogy, this becomes obvious. For example, let us assume that the price is cyclic, just to help your understanding. Let us assume that the price shows one large cycle and one small cycle. With these two cycles, the best buy entry can be calculated when the sum of both cycles provide the lowest price. The turning point like this is the entry where we can maximize our profit with the lowest risk. “Pattern inside pattern” analysis (PPA) is the similar technique to find the optimal entry in the financial market data, where fractal wave is dominating instead of the cycles.
If the above cycle example is still not clear, then let us introduce another simpler example to explain why “pattern inside pattern” analysis (PPA) is necessary. For example, say that there are two rivers with different size. If the two rivers join to create a bigger river, the river will push our boat with greater force too. Like this, in trading, it is advantageous to find the entry, where the joint force between two waves can create a positive synergy. This is the reason why we have to watch out the pattern inside pattern.
5. Fractal Wave
When we combine trend and cycle, we could create twelve price patterns. These twelve price patterns help us to understand the data as well as finding the right method to predict the data. Now we can extend these twelve price patterns by adding fractal wave. The column 1, 2 and 3 in this new table are the identical to the column 1, 2 and 3 of the existing table. In the column 4, we add the price pattern, which is the trend combined with multiple cycles. In the column 5, we add the price pattern, which is the trend combined with fractal wave. In our new table, we will have the twenty price patterns. Each column represents the regularity in data including trend, additive seasonality, multiplicative seasonality, multiple cycles and fractal wave. Depending on the characteristics of the data, we just need to choose the right method to predict the data. This will maximize our chance to predict the complex data more accurately.
In the new table, we can tell that the complexity of the price pattern increases from left to right. We can tell this by counting number of cycles in the data. For example, in the column 1, the trend column, there is no cycle. In the column 2, the additive seasonality column, there could be few cycles. Likewise, in the column 3, the multiplicative seasonality column, there could be few cycles too. In the column 4, the multiple cycle column, there could be some cycles but the number of cycles is still finite. In the column 5, the fractal wave column, we have the infinite number of cycles. I created this table to help you to compare the complexity of data with cycle and fractal wave. When we want to predict the fractal wave, it is best to find the method sufficiently flexible with the amplitude. To predict the fractal wave in the price series, the financial trading community developed the following methods, which are sufficiently flexible whether the amplitude of cycle is big or small.
• Horizontal support and resistance
• Diagonal support and resistance (i.e. trend lines)
• Triangle pattern
• Rising wedge and falling wedge patterns
• Supply demand zone analysis
• Fibonacci analysis
• Harmonic Pattern
• Elliott Wave Theory
• Gann’s methods
• Point and Figure Chart
• X3 Chart Pattern
As long as the price continuously rises and falls, we can utilize the fractal wave in our price analysis. After extensive price rise, the price must fall to realize the overvaluation of the price. Likewise, after extensive price fall, the price must rise to realize the undervaluation of the price. This price mechanism builds the complex zigzag path of the price movement in the financial market. Most of price data in the Forex and Stock market tend to follow this. Therefore, price pattern analysis are often heavily used to predict the price movement. Prior to apply these price patterns in the scientific way, the peak trough transformation is required. Peak trough transformation is the mathematical techniques to identify the peak and trough in turn to visualize the fractal wave in the price series. This technique is helpful to identify the price patterns like triangle, rising wedge pattern, falling wedge pattern, Elliott wave pattern, harmonic pattern and so on.
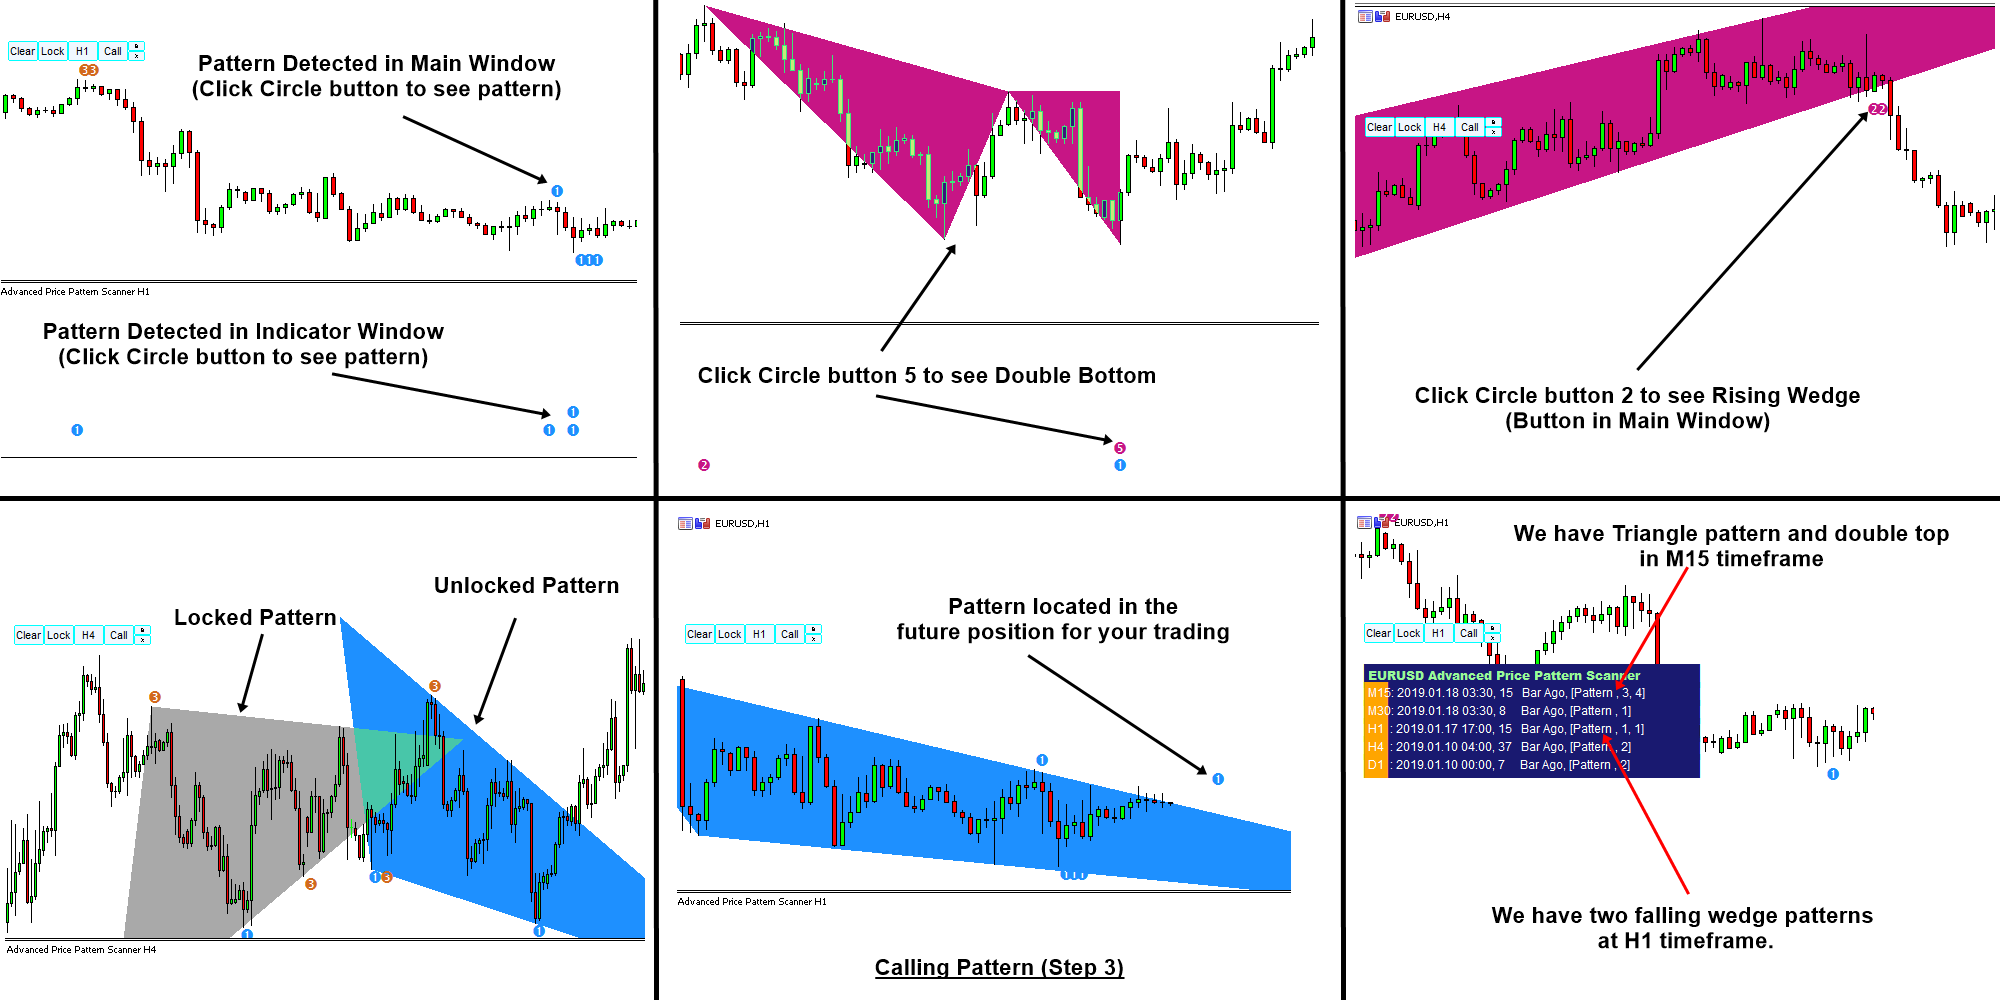
If you want to use the chart patterns in your trading, you might look at these two automatic price pattern scanner. They are Advanced Price Pattern Scanner and Price Breakout Pattern Scanner. Advanced Price Pattern Scanner is the non repainting price pattern scanner whereas Price Breakout Pattern Scanner is based on repainting pattern detection. You will feel that Advanced Price pattern Scanner is using completely new pattern detection algorithm from Price Breakout Pattern Scanner. Even same patterns are detected in different timing between them due the the different pattern detection algorithm.
However, Advanced Price Pattern Scanner is more expensive. Hence, if you are concerned with the price. Then you can still go ahead with Price Breakout Pattern Scanner. Price Breakout Pattern Scanner will do generally everything for your need from price pattern detection + Japanese candle stick pattern detection and so on. If you need the non repainting price pattern scanner, we certainly recommend to use Advanced Price Pattern Scanner. In addition, Advanced Price Pattern Scanner also provides the multiple timeframe pattern detection helping you to reduce number of charts to open.
Here are the links for Advanced Chart Pattern Scanner.
https://algotrading-investment.com/portfolio-item/advanced-price-pattern-scanner/
https://www.mql5.com/en/market/product/84567
https://www.mql5.com/en/market/product/84568
Below are the links to Price breakout Pattern Scanner
https://www.mql5.com/en/market/product/4859
https://www.mql5.com/en/market/product/4858
https://algotrading-investment.com/portfolio-item/price-pattern-scanner/
The book: Science Of Support, Resistance, Fibonacci Analysis, Harmonic Pattern, Elliott Wave and X3 Chart Pattern (In Forex and Stock Market Trading) is an dedicated book for the chart pattern analyst. This book will provide the scientific rational for chart patterns, connection with economics, chart pattern detection examples, how to use them and how to improve them in Forex and Stock market. Even if you are new or existing traders, we recommend this book because the book shares many fresh new ideas towards your day trading. The book can be found in all the major book distributors in the world. Please choose the best book distributor you like from the link below including amazon.com, Google Play Book, scribd.com, Apple Book and so on.
Related Products


