Great Technical Indicators for Price Action
Great technical indicators for Price Action can vary depending on individual trading styles, preferences, and market conditions. However, several widely-used technical indicators have stood the test of time and are commonly relied upon by traders. Before we go on to the great technical indicator, let us cover some basics of Price Action Trading. Price Action trading is a methodology used in forex trading and stock trading that relies on analyzing and making trading decisions based solely on price movements on a chart, without the use of technical indicators or with minimum use of the technical indicators. Instead, traders focus on studying historical price data, patterns, and market structure to identify potential trading opportunities.
Here we cover an overview of price action trading:
- Candlestick Patterns: Price action traders often pay close attention to candlestick patterns, which provide valuable information about market sentiment and potential reversals. Common candlestick patterns include doji, engulfing patterns, hammers, and shooting stars.
- Support and Resistance: Traders identify key support and resistance levels on the price chart, which represent areas where price has historically reversed or stalled. These levels help traders determine entry and exit points, as well as set stop-loss and take-profit levels.
- Trend Analysis: Price action traders analyze the overall trend direction by observing the highs and lows of price movements. They may use trendlines, channels, and moving averages to identify trends and potential trend reversals.
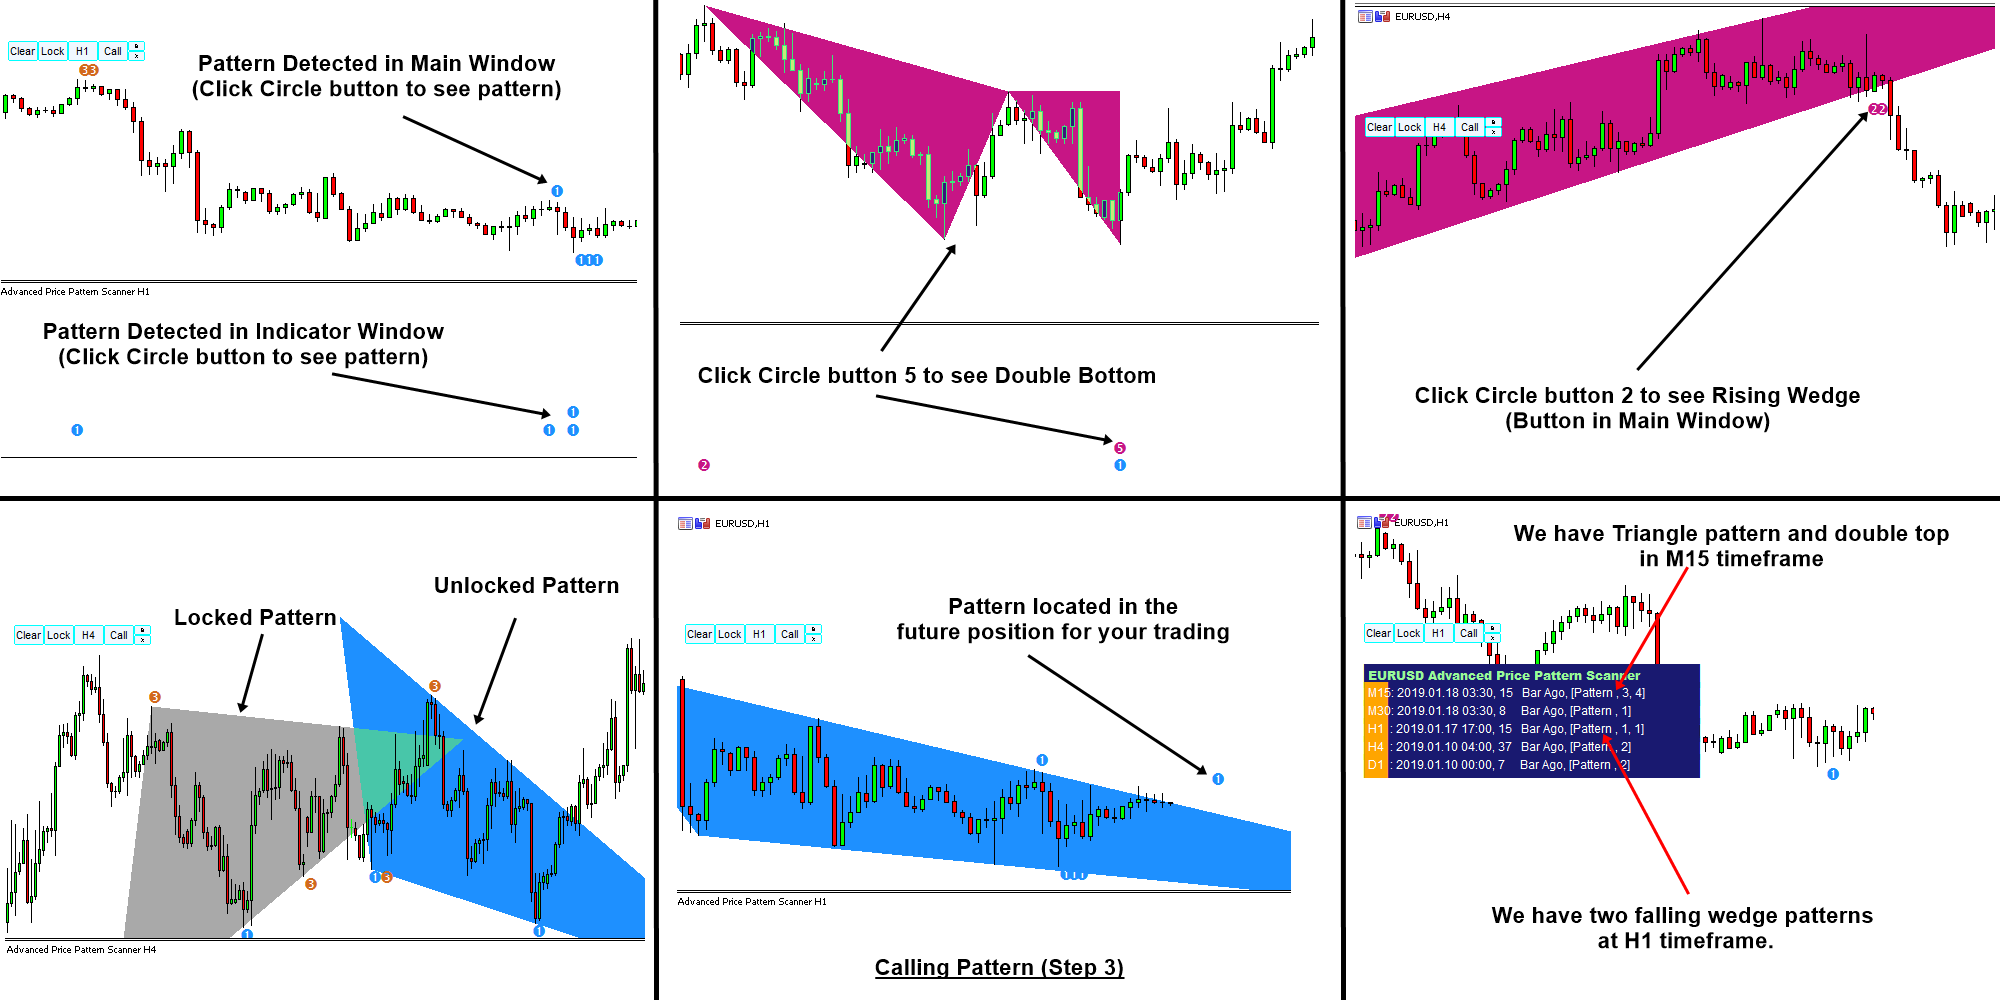
- Price Patterns: Price action traders look for specific price patterns that indicate potential trading opportunities, such as triangles, flags, pennants, and head and shoulders patterns.
- Market Structure: Understanding market structure, including swing highs and lows, helps price action traders identify the current market environment and make informed trading decisions.
- Multiple Time Frame Analysis: Price action traders often analyze price action on multiple time frames to gain a comprehensive view of the market. They may use higher time frames for trend analysis and lower time frames for entry and exit timing.
- Risk Management: Effective risk management is crucial in price action trading. Traders typically use techniques such as setting stop-loss orders based on support and resistance levels, using proper position sizing, and adhering to risk-reward ratios.
- Psychological Aspects: Price action trading requires discipline, patience, and the ability to control emotions. Traders must learn to trust their analysis and stick to their trading plan, even during periods of market volatility.
- Price action trading offers several advantages, including simplicity, clarity, and adaptability to different market conditions. However, it also requires a deep understanding of market dynamics and extensive practice to become proficient. Additionally, price action trading may not be suitable for all traders, as it requires a significant amount of time and effort to develop the necessary skills and experience.
Here is the list of great technical indicators for Price Action Trading. Both MetaTrader 4 and MetaTrader 5 versions are available.
1. Chart Pattern MT
Detecting price patterns like Triangle, Falling Wedge, Rising Wedge, Double Top, Double Bottom, Head and Shoulder, Reverse of Head and Shoulder, Cup and Handle or Cup with Handle, Reverse of Cup and Handle or Cup with Handle. What is even better, this is non repainting indicator, which means great for your trading. Plus this indicator can detect 52 Japanese candlestick patterns.
https://www.mql5.com/en/market/product/24679
https://www.mql5.com/en/market/product/84568
https://algotrading-investment.com/portfolio-item/chart-pattern/
2. Ace Supply Demand Zone indicator
Ace Supply Demand Zone indicator is a great indicator to extend support and resistance concept into supply and demand zone. This is powerful and great as it uses non repainting and non lagging algorithm.
https://www.mql5.com/en/market/product/40076
https://www.mql5.com/en/market/product/40075
https://algotrading-investment.com/portfolio-item/mean-reversion-supply-demand/
3. Mean Reversion Supply Demand
Mean Reversion Supply Demand is another affordable supply and demand zone trading system but with a lot of rich features. For your information, both ace supply demand zone and mean reversion supply demand use a complete different algorithm.
https://www.mql5.com/en/market/product/16823
https://www.mql5.com/en/market/product/16851
https://algotrading-investment.com/portfolio-item/mean-reversion-supply-demand/
4. Price Breakout Pattern Scanner
Price Breakout Pattern Scanner can also detect price patterns like riangle, Falling Wedge, Rising Wedge, Double Top, Double Bottom, Head and Shoulder, Reverse of Head and Shoulder. In addition, you can use the power of smart renko together.
https://www.mql5.com/en/market/product/4859
https://www.mql5.com/en/market/product/4858
https://algotrading-investment.com/portfolio-item/price-breakout-pattern-scanner/
5. Elliott Wave Trend
Elliott Wave Trend is extremely powerful indicator. Allow you to perform Elliott wave counting as well as Elliott wave pattern detection. On top of them, it provides built in accurate support and resistance system to improve your trading performance.
https://www.mql5.com/en/market/product/16479
https://www.mql5.com/en/market/product/16472
https://algotrading-investment.com/portfolio-item/elliott-wave-trend/
6. X3 Chart Pattern Scanner
X3 Chart Pattern Scanner is specialized tools in detecting profitable patterns including Harmonic Pattern and Elliott Wave Patterns. Pattern detection process is fully automatic + you can even create customized Elliott wave patterns if you wish.
https://www.mql5.com/en/market/product/35602
https://www.mql5.com/en/market/product/35603
https://algotrading-investment.com/portfolio-item/optimal-turning-point-pattern-scanner/
Related Products


