Probability to Predict Turning Point
Turning point probability refers to the likelihood or chance of a reversal occurring in a financial market at a specific price level or time. It involves analyzing various factors, such as historical price data, market sentiment, and technical indicators, to assess the probability of a trend reversal. Many trading strategies or statistical algorithms predicts the turning point to achieve the good buy and sell decision for the trader in Forex and Stock market. For example, Fibonacci trading, Support and resistance trading, Harmonic Pattern, Elliott Wave pattern and X3 Chart Pattern are concerning the prediction of turning point. Because the turning point prediction provides the most usable profitable range in our trading, this is inevitably popular trading strategy among trader. To help your understanding on the market cycle in the financial market, we will break down the complex subject into few simpler one in the context of making buy and sell decision in Forex and Stock market. These 7 points are the essential information you need to understand when you want to make a good buy and sell decision in Forex and Stock Market.
- Turning Point: a turning point is a price level in which the market can change its direction from bearish to bullish or from bullish to bearish. In fact, the turning point can be considered as the peak and trough in cycle. To visualize it, just consider a simple cycle like a sine curve or cosine curve ranging betweeen 1 and -1 in y axis. Then you can mark the peak at 1 and you can mark the trough at -1 in the curve.
- Stochastic cycle: Turning point becomes a powerful weapon when you understand the market cycle in Forex and Stock market. However the market cycle is not like a simple cycle like a sine curve or cosine curve. Instead, the market cycle is the stochastic cycle. For example, a sine curve is a determininstic cycle, whose cycle period is fixed. In stochastic cycle, the cycle period is not fixed but probablistic meaning that the cycle period can be alternating around the mean or average. The harder part is that, there are multiple of stochastic cycles in the market cycle of Forex and Stock market.
- Fractal Wave: Fractal wave is one tool that can study or predict all the stochastic cycles present in the market in both using statistical and non statistical methods. Fractal wave is simple and effective method proven for many decades along with the evolution of the financial market since Bernoit Mandelbrot dedicated most of his life to the study of fractals, as well as the mathematics of roughness and self-similarity.
- Fractal Wave for Non statistical method: Fibonacci trading, Support and resistance trading, Harmonic Pattern, Elliott Wave pattern and X3 Chart Pattern can be considered as the chart pattern analysis using the Fractal Wave concept.
- Fractal Wave for statistical method: Firstly, Fractal Wave theory can be used to perform the Fractal Decomposition technique to extract each market cycle (=stochastic cycle) in Forex and Stock market. Secondly, once the Fractal Decomposition is done, one can visualize each stochastic cycle using Fractal Cycle Analysis.
- Turning Point Probability: turning point probability is the probability measured in each stochastic cycle extracted and visualized in the Fractal Cycle Analysis to indicate the potential turning point to make a buy or sell decision. Just like other probability, the turning point probability ranges between 0 and 1 or between 0% and 100%.
- Trend Probability: Although there are many ways to calcualte the trend probability, one can simply calculate the trend probabilty in the Stochastic cycle uisng this simple equation: “the trend probability = 1.0 – the turning point probability”.
To present the turning point probability in Forex and Stock Market, we have devised the simple turning point probability graph. When we predict the peak, in the probability graph, Y axis (=the left axis) indicates the turning point probability in price dimension and X axis (= the bottom axis) indicates the turning point probability in time dimension. The probability ranges from 0.0 (=0%) to 1.0 (=100%). Typically, there is no practical application making use of 100% probability in the world. Since our calculation is based on the price data only (i.e. empirical probability), we recommend using 90% probability or less for the maximum probability. For example, even if the price stays above the 90% probability, it is better to treat them as 90% or less depending on how conservative your trading style is.
To help with practical trading, we can provide the Fibonacci retracement ratio in the same graph. Hence, we can use top axis and right axis to respectively represent the Fibonacci retracement in time and price. The way it works is nearly identical to the Fibonacci ratio analysis. Although many trading strategy are based on Fibonacci ratio analysis in price only, the Fibonacci Probability graph provides the additional Fibonacci ratio analysis in time dimension too.
On the right axis, we can place some important Fibonacci retracement ratio in price including 38.2%, 50%, 61.8% and so on. All the ratios are calculated with the absolute value of price height. The formula to calculate the Fibonacci retracement ratio is like below.
Fibonacci retracement ratio in price = Right swing of fractal triangle (Y0) / Left swing of fractal triangle (Y1)
Likewise, the top axis provides the Fibonacci retracement ratio measured in time dimension. All the ratios are calculated with the absolute value of time width. We use the identical formula to calculate the ratio as below:
Fibonacci retracement ratio in time = Right swing of fractal triangle (X0) / Left swing of fractal triangle (X1)
The graph with the four axes of probability and Fibonacci retracement ratio is called Fibonacci Probability graph. The Fibonacci Probability graph is a simple but powerful tool to predict the arrival of the turning point within a specific fractal wave cycle.
To predict the turning point more accurately, we need to observe more than one fractal cycle. To do that, we can use a stacked bar graph to represent the turning point probability of each cycle. For example, we can draw the turning point probability for small cycle on the bottom of the graph and we can draw the turning point probability for large cycle above. When we stack up the bar graph for several cycles, we could have the nice overview of the turning point probability for multiple cycles. Of course, it is possible to stack up more than two bar graphs sharing the same time axis.
When the turning point probability is high, we can expect the turning point to arrive within the fractal cycle. Like the margin of safety described by Benjamin Graham, it is safe to use the turning point probability in conservative manner. We should only look for the turning point within the higher probability area. The margin of safety will tell that higher turning point probability is safer to predict the turning point. On the other hand, we can look for the breakout opportunity or we can expect the price to move in the same direction within the lower turning point probability area. We can consider the trend probability providing the opposite concept of the turning point probability. In a simple math, we can derive the trend probability by subtracting the turning point probability from one like “1.0 – the turning point probability”. Or if you prefer the percent, we can derive the trend probability by subtracting the turning point probability (%) from one hundred percent like “100% – turning point probability (%)”. Since the turning point probability is drawn from the peak trough transformation directly, the conversion of the trend probability from the turning point probability should be taken as the rule of thumb guideline for your trading. As in the turning point probability, the margin of safety will tell that higher trend probability is safer to predict the breakout or price continuation.
From the simple math for the trend probability (= 1.0 – the turning point probability), we can tell that high turning point probability is equal to the low trend probability. Likewise, we can tell that low turning point probability is equal to the high trend probability. For the first example, say that the price is moving down from the last peak. If the turning point probability is less than 50%, there is a high chance that price will continue to fall. It can be confirmed because the trend probability is greater than 50% (=100% – 50%). The chance that price will continue to fall is even higher if the turning point probability is less than 30%. It can be confirmed because the trend probability is greater than 70% (=100% – 30%). If we need to predict the breakout or price continuation, then it would be safer to choose the trend probability 70% or over in this example.
For the second example, say that the price is moving up from the last trough. If the turning point probability is less than 50%, there is a high chance that price will continue to rise. It can be confirmed because the trend probability is greater than 50% (=100% – 50%). The chance that price will continue to rise is even higher if the turning point probability is less than 30%. It can be confirmed because the trend probability is greater than 70% (=100% – 30%). If we need to predict the breakout or price continuation, it would be safer to choose the trend probability 70% or over in this example. These examples are purely based on the interpretation of the probability alone. However, the usage of the turning point probability or the trend probability can be extended with other price pattern analysis. At the most basic level, you could use the given Fibonacci retracement level together with the turning point probability. In the next chapter, we will discuss some other ways to combine the turning point probability with other price patterns.
Check the Turning Point and Trend article in supporting this trading idea.
https://algotrading-investment.com/2019/07/06/turning-point-and-trend/
https://algotrading-investment.com/2021/12/12/how-to-improve-supply-and-demand-analysis/
In spite of fact that there are many trading strategy uses turning point prediction, there are none of trading techniques providing the exact account of each turning point in probability.
Fractal Pattern Scanner is designed to predict the next turning point with probability measurement. Hence, this Fractal Pattern Scanner can be used together or on its own.
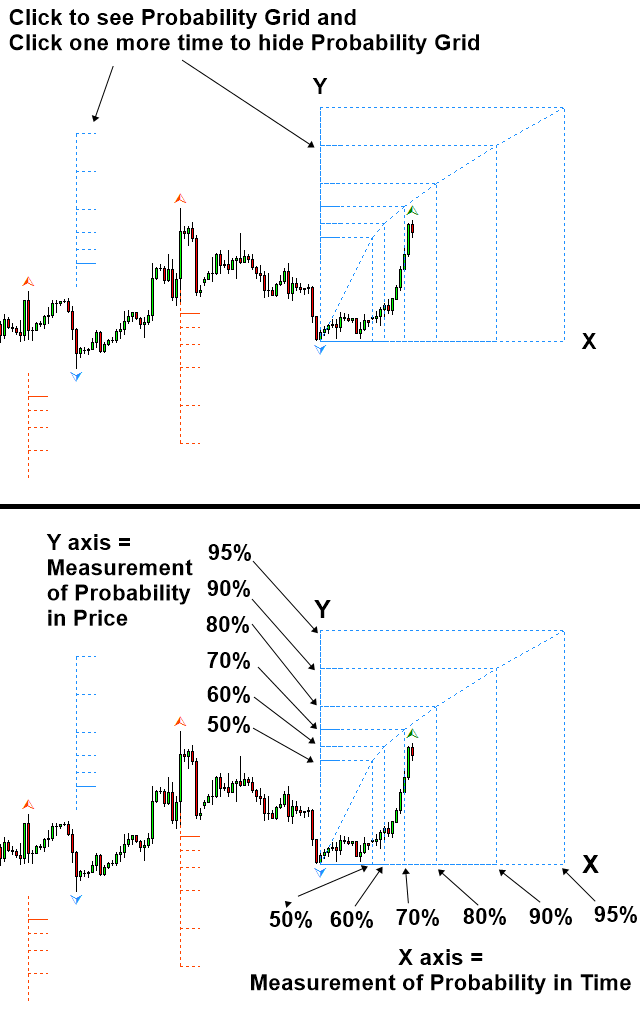
Here, we will briefly look at the Probability Grid provided from Fractal Pattern Scanner. This Probability Grid consists of Y and X axis. The vertical measurement provide the probability of turning point in price. The horizontal measurement provides the probability of turning point in time.
The probability measurement is taken from the start of peak or trough to predict next turning point. Hence, the probability increase from bottom to top for price and left to right for time.
For easy measurement, we provide 50%, 60%, 70%, 80%, 90% and 95% probability in price and time.
https://www.mql5.com/en/market/product/49170
https://www.mql5.com/en/market/product/49169
https://algotrading-investment.com/portfolio-item/fractal-pattern-scanner/
Probability Grid to Predict Turning Point
In trading, turning point prediction is the goal of many trading strategy. For example, Fibonacci trading, Support and resistance trading, Harmonic Pattern, Elliott Wave pattern and X3 Pattern are concerning the prediction of turning point. Because the turning point prediction provides the most usable profitable range in our trading, this is inevitably popular trading strategy among trader.
Check the Turning Point and Trend article in supporting this trading idea.
https://algotrading-investment.com/2019/07/06/turning-point-and-trend/
In spite of fact that there are many trading strategy uses turning point prediction, there are none of trading techniques providing the exact account of each turning point in probability.
Fractal Pattern Scanner is designed to predict the next turning point with probability measurement. Hence, this Fractal Pattern Scanner can be used together or on its own.
Here, we will briefly look at the Probability Grid provided from Fractal Pattern Scanner. This Probability Grid consists of Y and X axis. The vertical measurement provide the probability of turning point in price. The horizontal measurement provides the probability of turning point in time.
The probability measurement is taken from the start of peak or trough to predict next turning point. Hence, the probability increase from bottom to top for price and left to right for time.
For easy measurement, we provide 50%, 60%, 70%, 80%, 90% and 95% probability in price and time.
https://www.mql5.com/en/market/product/49170
https://www.mql5.com/en/market/product/49169
https://algotrading-investment.com/portfolio-item/fractal-pattern-scanner/
Related Products


