Elliott Wave Trading
The purpose of Elliott Wave Trading is to use the patterns of price movements that reflect the psychology and sentiment of investors to forecast market trends and identify potential entry and exit points for trading. To use this sophisticated tools, you need to understand what Elliott Wave Theory is. Ralph Nelson Elliott was one of very first person who believed that he could predict the stock market by studying the repeating patterns in the price series. To prove this idea, he created the Wave Principle. Many years later, the Wave Principle was reintroduced in the Prechter’s Elliott Wave books to investors. The Wave Principle states that the wave patterns are repeating and superimposing on each other forming complex wave patterns. The advantage of Elliott Wave theory is that it is comprehensive as the theory can provide multiple trading entries on different market conditions. Elliott Wave theory can be used for both momentum trading and mean reversion trading. The disadvantage of Elliott Wave theory is that it is more complex comparing to other trading techniques. In addition, there are still some loose ends in detecting Elliott wave patterns. For this reason, many traders heavily criticize the lack of scientific methods of counting Elliott Waves.
The Wave Principle states that the crowd or social behaviour follows a certain wave patterns repeating themselves. The Wave Principle identifies two wave patterns. They are impulse and corrective wave. Often, the term impulse wave is interchangeably used with the motive wave. Two terms are identical. Both motive and impulse wave progress during the main trend phase whereas the corrective wave progress during the corrective phase against the main trend. In general, the Impulse Wave has a five-wave structure, while the Corrective Wave has a three-wave structure. It is important to understand that these wave structures can override on smaller wave structure to form greater wave cycle. Elliott Wave theory is useful in identifying both trend market and correction market.
Elliott Wave theory can be beneficial to predict the market movement if they are used correctly. Junior traders are often fear to use Elliott Wave because their complexity. From my experience, Elliott wave is not a rocket science, anyone can probably learn how to use the technique with some commitment. However, not all the book and educational materials will teach them in the scientific way. If we are just looking at the three rules from the original Wave principle only, there are definitely some rooms where subjective judgement can play in our wave counting. This makes the starters to give up the Elliott Wave Theory quickly. Fortunately, there are some additional tools to overcome the subjectivity in our wave counting. First tool but the most important tool is definitely the three wave rules from the original Wave Principle. They can be used as the most important guideline for the wave counting. Below we describe the three rules:
• Rule 1: Wave 2 can never retrace more than 100 percent of wave 1.
• Rule 2: Wave 4 may never end in the price territory of wave 1.
• Rule 3: Out of the three impulse waves (i.e. wave 1, 3 and 5), wave 3 can never the shortest.
Second tool is the Fibonacci ratio. As in the Harmonic pattern detection, Fibonacci ratio can play an important role in our wave counting because they describe the wavelength of each wave in regards to their neighbouring wave. For example, the following relationship is often found among the five wave of the impulse wave. Depending on which wave is extended among wave one, three and five, the Fibonacci ratios are different. Most of time, the extension of wave 3 is most frequently observed in the real world trading.
Unless wave 1 is extended, wave 4 often divides five impulse waves into the Golden Section. If the wave 5 is not extended, the price range from the starting point of wave 1 to the ending point of wave 4 make up 61.8% of the overall height of the impulse wave. If wave 5 is extended, then the price range from the starting point of wave 1 to the ending point of wave 4 make up 38.2% of the overall height of the impulse wave. These two rules are rough guideline. Sometime, trader can observe some cases where these two rules are not hold true. Personally, I normally place the Fibonacci ratio relationship before this Golden Section rule. However, the priority between these two rules might depend on the preference of traders.
The corrective wave is often retrace 61.8% or 32.8% against the size of previous impulse wave. In general, Elliott suggested that corrective wave 2 and wave 4 have the alternating relationship. If wave 2 is simple, then wave 4 is complex. Likewise, if wave 2 is complex, then wave 4 is simple. A “Simple” correction means only one wave structure whereas a “Complex” correction means three corrective wave structures. Furthermore, if wave 2 is sharp correction, then wave 4 can be sideways correction. Likewise, if wave 2 is sideways correction, then wave 4 can be sharp correction.
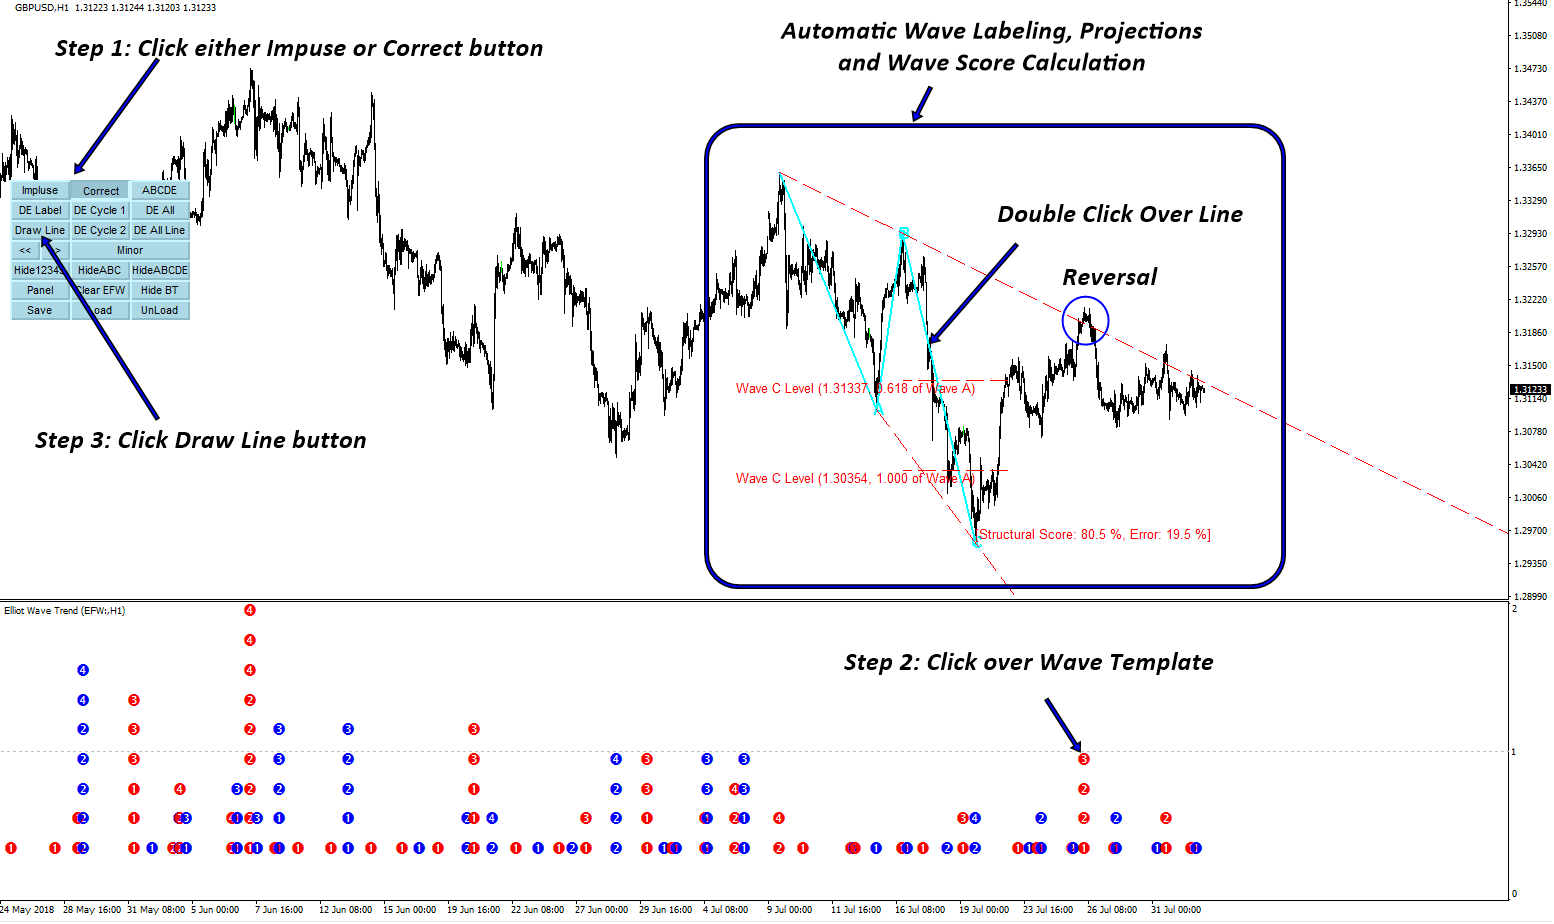
Below articles will provide a guide to count Elliott Wave using scientific approach. Applying the scientific approach helps to reduce the subjectivity involved in Elliott Wave counting. Hence, you can reproduce your trading outcome over and over.
● Introduction to the Wave Principle
https://algotrading-investment.com/2020/06/04/introduction-to-the-wave-principle/
● Scientific Wave Counting with the Template and Pattern Approach
● Impulse Wave Structural Score and Corrective Wave Structural Score
https://algotrading-investment.com/2020/06/04/channelling-technique-elliott-wave/
Some More Tips about Elliott Wave Trading
Elliott Wave Theory, developed by Ralph Nelson Elliott, is a popular method of technical analysis that aims to predict market trends by identifying repeating wave patterns. The theory posits that market prices move in predictable cycles or waves, which can be categorized into impulsive and corrective phases. Understanding these waves can help traders identify trends and breakout points in the market.
Elliott Wave Theory: Overview
Basic Principles
- Impulsive Waves: These waves move in the direction of the primary trend and consist of five sub-waves (labeled 1, 2, 3, 4, 5).
- Corrective Waves: These waves move against the primary trend and consist of three sub-waves (labeled A, B, C).
Wave Patterns
- Five-Wave Pattern: Represents the impulsive phase with three motive waves (1, 3, 5) and two corrective waves (2, 4).
- Three-Wave Pattern: Represents the corrective phase with two corrective waves (A, C) and one motive wave (B).
Trend Identification with Elliott Wave Theory
Identifying Trends
- Impulsive Phase:
- Wave 1: The initial move in the trend direction, often difficult to identify initially.
- Wave 2: Retracement of Wave 1, usually correcting a portion of the previous move.
- Wave 3: Strongest and longest wave, confirming the trend.
- Wave 4: Another corrective wave, typically shallower than Wave 2.
- Wave 5: Final move in the direction of the trend, often showing signs of weakening.
- Corrective Phase:
- Wave A: The first move against the prevailing trend.
- Wave B: A retracement of Wave A, often mistaken for a continuation of the trend.
- Wave C: The final move completing the correction, usually ending below the start of Wave A in a downtrend or above the start of Wave A in an uptrend.
Application in Trend Identification
- Bullish Trend: Identified by a completed five-wave impulsive pattern followed by a three-wave corrective pattern.
- Bearish Trend: Identified by a three-wave corrective pattern followed by a five-wave impulsive pattern to the downside.
Breakout Trading with Elliott Wave Theory
Identifying Breakouts
- Breakout from Corrective Patterns:
- After completing a three-wave corrective pattern, the price often breaks out in the direction of the original trend (e.g., after Wave C completes, the price may break out upward in a bullish trend).
- Wave 3 Breakout:
- Wave 3 is typically the strongest wave, and a breakout can be identified when the price moves above the high of Wave 1.
- Wave 5 Breakout:
- Although Wave 5 is the final wave in the trend direction, it can still present breakout opportunities, especially when supported by strong momentum.
Trading Strategies for Breakouts
- Entering at Wave 3:
- Entry Point: Enter when Wave 2 completes and Wave 3 begins, ideally confirmed by a breakout above the high of Wave 1.
- Stop-Loss: Place a stop-loss below the low of Wave 2.
- Take-Profit: Target the end of Wave 3, often the longest and most powerful wave.
- Entering at Wave 5:
- Entry Point: Enter at the beginning of Wave 5, after the completion of Wave 4.
- Stop-Loss: Place a stop-loss below the low of Wave 4.
- Take-Profit: Target the end of Wave 5, typically confirmed by signs of trend exhaustion.
- Breakout from Corrective Patterns:
- Entry Point: Enter when Wave C completes, anticipating the resumption of the primary trend.
- Stop-Loss: Place a stop-loss below the end of Wave C (for bullish setups) or above the end of Wave C (for bearish setups).
- Take-Profit: Target the previous trend high (for bullish setups) or low (for bearish setups).
Example
Scenario: EUR/USD on a daily chart
- Identify the Five-Wave Impulsive Pattern:
- Wave 1: Initial move upward.
- Wave 2: Retracement of Wave 1.
- Wave 3: Strong upward move, breaking the high of Wave 1.
- Wave 4: Shallow retracement.
- Wave 5: Final upward move, showing signs of weakening.
- Identify the Three-Wave Corrective Pattern:
- Wave A: Initial move downward.
- Wave B: Retracement upward, not exceeding the high of Wave 5.
- Wave C: Final move downward, completing the correction.
- Breakout Trade Setup:
- Entry Point: Enter a long position at the end of Wave C, anticipating the start of a new impulsive phase.
- Stop-Loss: Place a stop-loss below the low of Wave C.
- Take-Profit: Target the high of Wave 5, or use the length of Wave 1 projected from the end of Wave C for a more extended target.
Conclusion
Elliott Wave Theory provides a comprehensive framework for identifying trends and trading breakouts in the forex market. By understanding the structure of impulsive and corrective waves, traders can better anticipate market movements, identify key turning points, and set up trades with well-defined entry and exit points. This method requires practice and a good grasp of wave patterns, but it can significantly enhance a trader’s ability to navigate the complexities of the forex market.
About this Article
This article is the part taken from the draft version of the Book: Scientific Guide to Price Action and Pattern Trading (Wisdom of Trend, Cycle, and Fractal Wave). Full version of the book can be found from the link below:
Elliott Wave Trend is extremely powerful indicator. Allow you to perform Elliott wave counting as well as Elliott wave pattern detection. On top of them, it provides built in accurate support and resistance system to improve your trading performance. You can watch this YouTube Video to feel how the Elliott Wave Indicator look like:
https://www.youtube.com/watch?v=Oftml-JKyKM
Here is the landing page for Elliott Wave Trend.
https://www.mql5.com/en/market/product/16479
https://www.mql5.com/en/market/product/16472
https://algotrading-investment.com/portfolio-item/elliott-wave-trend/
Related Products


