Volatility Indicator for Day Trading
We can relate price and time into the geometric dimension using probability, that is known as Volatility in Financial Trading World. One of important questions are not yet answered. The unanswered question is what probability we can select for our trading and how we can select them for our trading. For example, Gann mentioned that he come up with the important nine angles from his empirical study on stock market. It seems that inclusion of 45 geometric angle among nine of them is very intuitive choice if price and time really balances. Probability works slightly different from angle. Probability can help us to describe the state of the market as an event. For example, in the statistical point of view, there are 50% to 50% chance for the price going up or going down. Including the sideways market state, each state of the market can be expressed as the 33.3% probability for bearish, bullish and sideways markets (Figure 3-1). Simply speaking if the price stays between price A and price B, then we can assume that market is moving in sideways (Figure 3-1). This approach is intuitive. However, we still does not have the sufficient lines as Gann’s angle provided nine geometric lines for traders. To produce nine geometric lines for traders, we can split both bullish region and bearish region into subsection as Gann did. Hence, we can use the Fibonacci ratio to derive the Volatility lines corresponding to Gann’s angles.
We found that using golden ratio 0.618 seems working out pretty well. Instead of using 33.3% probability for sideways, we can use 38.2% probability. The 38.2% probability (i.e. probability inside boundary) corresponds to the 61.8% probability, which describes the chance for the price to be outside the price A and price B (i.e. probability outside boundary). Since we have the 61.8% probability for the first value, it is easy to derive rest using golden ratio 0.618. For example, if we can keep multiplying 0.618 to derive next probability. So we will continue to have 0.382 (38.2%), 0.236 (23.6%), 0.146 (14.6%), etc until we have nine lines. The derived probabilities using the Golden ratio is listed in Table 3-1. When we derived our 9th lines, the corresponding probability is 1.3%. This 1.3% probability seems quite reasonable probability since many real world applications put the particular emphasis on 1% and 5% probability level.
Each section between two probability lines can be used to describe the state of the market. For example, the section between 61.8% and 38.2% probability line can be denoted as Bullish 1 state. Likewise, the probability line between 38.2% and 23.6% can be described as Bullish 2 state. The last state is Bullish 8. For bearish market, we can have eight states from bearish 1 to bearish 8. Since we used the Golden ratio to derive these geometric lines, we named this indicator as the Harmonic Volatility line indicator.
Since we have devised the Harmonic Volatility line indicator to overcome the chart scaling issue in the Gann’s angle, Harmonic Volatility line indicator is comparable to the Gann’s angle in many ways. Certainly, there will be some similarities between them. For example, trader can always locate the Harmonic Volatility Line indicator to the peaks and troughs where they can locate the Gann’s angle. This simply tells the good compatibility between Gann’s angle and the Harmonic Volatility Line indicator. In terms of usage, the Harmonic Volatility Line indicator can be used to fulfil the same functionalities, which is offered by Gann’s angle. For example, the Harmonic Volatility Line indicator can be used for market forecasting, turning point prediction, supports and resistances. In fact, because the Harmonic Volatility Line indicator uses volatility concept, there are additional benefits for traders to know the volatility information at any time.
Gann’s angle uses the angle to relate price and time. However, the Harmonic Volatility Line indicator uses the probability to relate price and time. Therefore, some distinctive difference exists between them too. Most important difference is that the Harmonic Volatility Line indicator draws curve instead of the straight line. In addition, nine states in the Harmonic Volatility Line indicator can be used together with the probabilistic interpretation whereas angle does not provide such information. For example, nearly 98.7% of time, the price will not cross this 1.3% probability line. What would this suggest in real world trading? It would suggest that we could expect to have some turning point if price crossed these 1.3% probability lines. We will further discuss the practical application of the Harmonic Volatility Line indicator in the next chapter.
Application of Volatility Indicator
The advantage of Harmonic volatility line indicator is that it is not suffering from the chart scaling issue like Gann’s angle. What about its usage in real world trading? We have found some comparable advantage of the harmonic volatility line indicator to the Gann’s angle. The way one can apply the harmonic volatility line indicator is nearly similar to Gann’s angle. Trader need to apply the Harmonic Volatility Line indicator to some significant peaks and troughs like the Gann’s suggestion. Once you have applied the Harmonic Volatility Line indicator to the significant peaks and troughs, you can use it for at least three different purpose for your trading. They are market forecasting, turning point prediction, supports and resistances. We will describe each of them by comparing the Harmonic Volatility Line indicator to the Gann’s angle.
Market Forecasting
Gann used the geometric angle to identify strong bullish and bearish market. For example if the price remain below the 1×1 descending angle line, then it is bearish market. If the price remains above the 1×1 ascending angle line, then it is bullish market. In the Harmonic Volatility Line indicator, there are two sideways state among 18 states. The two sideways state roughly corresponds to the sideways market probability of 33.3%. Remember that we have widen the 33.3% up to 38.2% probability to apply the Golden ratio rule to derive the other probabilities. We can still use this 38.2% probability to identify the sideways state of the market. If the price stays inside the two sideways states, then we can say that market is moving in sideways.
Picking up the probability line equivalent to the 1×1 angle line is tricky since we have to compare the curve to straight line. However, if we have to choose one line, then I think 23.6% probability line might be the choice. It is because the 23.6% probability line divide the entire area into half. Therefore, trader can assume the strong bullish trend if the price remains above the 23.6% ascending probability line whereas weak bullish trend can be assumed if the price remains below 23.6% ascending probability line. Likewise, trader can assume the strong bearish trend if the price remains below the 23.6% descending probability line whereas weak bullish trend can be assumed if the price remains below the 23.6% descending probability line.
In addition, trader can assume bullish trend if the price move from lower Bullish state to upper Bullish state. For example, if the price move from Bullish 1 state to Bullish 2 state, then we can assume the market has a bullish trend. On the other hands, if price move from Bullish 5 state to Bullish 4 state, then market have a bearish trend. Likewise, if the price move from lower Bearish state to upper Bearish state, then you can assume bearish trend. For example, if the price move form Bearish 1 state to Bearish 2 state, then we can assume that the market is bearish. Sometimes price might penetrate two or three states at the same time showing strong trend.
Supports and Resistances
Gann used the geometric angle as the supports and resistances. The same analogy can be applied to the Harmonic Volatility Line indicator. Frequently, you will observe that the probability lines in the Harmonic Volatility Line indicator act as an important supports and resistances in your chart.
Turning Point Prediction
Gann used the geometric angle to predict the turning point when many angles are intersecting together. Likewise, when many probability lines are intersecting together, the Harmonic Volatility Line indicator shows strong turning point too. In addition, the Harmonic Volatility Line indicator can predict turning point from the volatility point of view. As we have discussed in the previous chapter, if price crosses the 1.3% probability line, then there is high chance that price will reverse. In fact, when the price remains in the Bullish 6, 7 and 8 states, you might watch out for the potential turning point. Likewise, when the price remains in the Bearish 6, 7 and 8 states, you might be warned for the potential bullish turning point too. Gann’s angle does not offer this information to traders because angle does not indicate the volatility of the market.
Combining with Other Technical Analysis
As Gann’s angle can be used with other technical analysis, the Harmonic Volatility Line indicator can be used with other technical analysis. Both mean reversion and momentum trading strategies can be combined with it. You can use the Harmonic Volatility Line indicator as the primary decision making tool or as the secondary confirmation tool according to your trading style. When the Harmonic Volatility Line indicator is combined with other technical analysis, it would definitely provide edge for your trading. Volatility indicator can help you to detect any statistical advantage for your trading. Especially, if you are trading with Price Action and Price Patterns, then we recommend to use the Volatility indicator together with your strategy. We provide the advanced volatility indicators for MetaTrader 4 and MetaTrader 5 platform.
Fibonacci Volatility Indicator
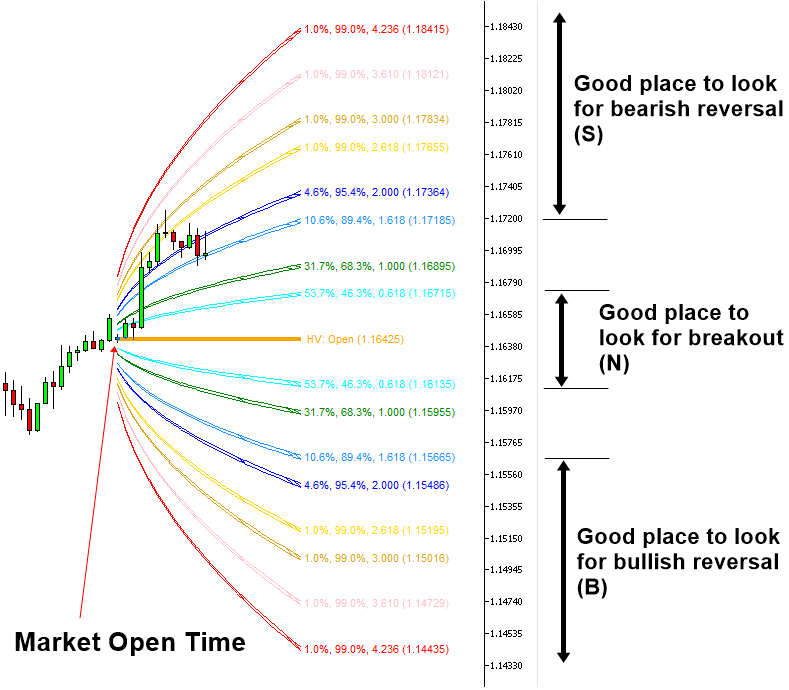
Fibonacci Volatility indicator can provide the market volatility in visual form in your chart for your trading. You can use Daily, Weekly, Monthly and Yearly Volatility for your trading. The most important application of this Volatility indicator is to detect the potential breakout area, potential bullish reversal area and potential bearish reversal area. When you want to visualize the Volatility for your trading, this is the best tool available in the market. Additionally, you can also use the Movable Volatility indicator too.
https://www.mql5.com/en/market/product/52671
https://www.mql5.com/en/market/product/52670
https://algotrading-investment.com/portfolio-item/fibonacci-volatility-indicator/
Harmonic Volatility Indicator
Harmonic Volatility indicator also provides the market volatility in visual form in your chart for your trading. This tool can be used to visualize the Daily, Weekly, Monthly and Yearly Volatility. The difference between Harmonic Volatility indicator and Fibonacci Volatility indicator is that you can only use Probability Configuration mode in the Harmonic Volatility indicator whereas in the Fibonacci Volatility indicator you can access both Probability Configuration and Z Score configuration. This is cheaper than Fibonacci Volatility indicator.
https://www.mql5.com/en/market/product/29008
https://www.mql5.com/en/market/product/29004
https://algotrading-investment.com/portfolio-item/harmonic-volatility-indicator/
Double Harmonic Volatility Indicator
This is the cheapest Volatility indicator. This indicator is specialized in the Movable Volatility indicator mostly. Hence, if you only need the Movable Volatility indicator and you want to have more cost effective tool, then use this. However, if you want to have more choice in the Volatility visualization, then use either Harmonic Volatility indicator or Fibonacci Volatility indicator.
https://www.mql5.com/en/market/product/23779
https://www.mql5.com/en/market/product/23769
https://algotrading-investment.com/portfolio-item/double-harmonic-volatility-indicator/
GARCH improved Nelder Mead – Free indicator
This is free Volatility indicator that implements the Generalized Autoregressive Conditional Heteroskedasticity (GARCH) methods with Nelder Mead algorithm. This is bit of experimental indicator to realize the GARCH (1,1) model. Hence, we provide this indicator for free. It would be interesting to see how this Volatility indicator works for your trading.
https://www.mql5.com/en/market/product/6918
https://www.mql5.com/en/market/product/6910
https://algotrading-investment.com/portfolio-item/garch-improved-nelder-mead/
Related Products


