Great Technical Indicator List
Technical indicators are used by traders to gain insight into the supply and demand of securities and market psychology. Together, these great technical indicators can form the powerful decision making tool for your trading. Some of the great technical indicators are covered under the list below. We provide the list of great technical indicator we provide through www.algotrading-investment.com and mql5.com. For each indicator, we provide a short summary to give you quick idea about the technical indicator. If you want to know more details about the technical indicator, then please use the provided link.
● Ace Supply Demand Zone:: This is the Supply and Demand indicator. It is the advanced support and resistance tool to spot breakout and reversal opportunity by detecting significant price level in the market. What is even better? This is non-repainting and non-lagging indicator.
https://algotrading-investment.com/portfolio-item/ace-supply-demand-zone/
● Chart Pattern MT:: It is the chart pattern scanner. It is designed to scan the Triangle, Falling Wedge, Rising Wedge, Double Top, Double Bottom, Head and Shoulder, Reverse of Head and Shoulder, Cup and Handle or Cup with Handle, Reverse of Cup and Handle or Cup with Handle. What is even better? This is non-repainting and non-lagging indicator. Here is link for more information.
https://algotrading-investment.com/portfolio-item/chart-pattern/
● Auto Chart Alert:: Auto Chart Alert is a chart tool to set alert for your trading in your chart. It is good tool especially for Price Action Trading. This is free chart tool.
https://algotrading-investment.com/portfolio-item/auto-chart-alert/
● Double Harmonic Volatility Indicator:: Double Harmonic Volatility Indicator is the volatility calculator designed to identify the high and low volatlility in Forex and Stock market. The algorithm behind the double Harmonic Volatility indicator is based on the Fibonacci analysis. Originally, Harmonic Volatility Indicator was developed to overcome the limitation and the weakness of Gann’s Angle, also known as Gann’s Fan. We have demonstrated that Harmonic Volatility Indicator can be applied in a similar manner to Gann’s Angle.
https://algotrading-investment.com/portfolio-item/double-harmonic-volatility-indicator/
● Elliott Wave Trend:: Elliott Wave Trend is the Elliott Wave indicator in the market. It helps you to count Elliott Wave and to identify Elliott Wave Patterns with the wave score. It also provides accurate support and resistance even to improve your trading performance. Great tool bring the legendary trading strategy into your own trading.
https://algotrading-investment.com/portfolio-item/elliott-wave-trend/
● Equilibrium Fractal Wave Analytics:: This wave indicator can help you to identify superimposed wave patterns automatically. It allows you to detect place where multiple channels are intersect together. The intersecting place is typically you can predict reversal and breakout opportunity with great accuracy.
https://algotrading-investment.com/portfolio-item/equilibrium-fractal-wave-analytics/
● Excessive Momentum Indicator:: Excessive Momentum indicator is a momentum indicator to capture the excessive momentun in bullish and bearish price swings in Volume Spread Analysis Context. In opposite to sideways market, this excessive momentum can signal us early that brand new trend will happen soon in the market. Excessive momentum indicator provides accurate market timing for you to place your buy and sell position. https://algotrading-investment.com/portfolio-item/excessive-momentum-indicator/
● GARCH Improved Nelder Mead:: This tool was implemented using GARCH volatility model. It is volatility prediction tool. This is free. https://algotrading-investment.com/portfolio-item/garch-improved-nelder-mead/
● Harmonic Pattern Plus:: One of the first automated Harmonic Pattern indicator released in 2014. It can detect 11 most popular harmonic patterns with well-defined trading entries and stops. Pattern Completion Interval, Potential Reversal Zone and Potential Continuation Zone are supported. In addition, other dozens of powerful features are added like Japanese candlestick detection, etc. https://algotrading-investment.com/portfolio-item/harmonic-pattern-plus/
● Harmonic Pattern Scenario Planner:: It is an advanced Harmonic Pattern detection indicator. On top of the features of Harmonic Pattern Plus, you can also predict future harmonic patterns through simulation. This is the tactical harmonic pattern tool designed for Professional harmonic pattern trader. https://algotrading-investment.com/portfolio-item/harmonic-pattern-scenario-planner/
● Harmonic Volatility Indicator:: Harmonic Volatility Indicator is the first technical analysis applying the Fibonacci analysis to the financial Volatility. Harmonic volatility indicator is another level of price action trading tool which combines robust Fibonacci ratios (0.618, 0.382, etc) with trading volatility. https://algotrading-investment.com/portfolio-item/harmonic-volatility-indicator/
● Mean Reversion Supply Demand:: Mean Reversion Supply Demand is a market equilibrium indicator to identify the quantity mismatching between buying and selling volumes in Forex and Stock market. With many powerful features added, you can trade with this tool for precise money management. Market profile indicator is an added bonus for your trading. https://algotrading-investment.com/portfolio-item/mean-reversion-supply-demand/
● X3 Chart Pattern Scanner:: This is the next generation technical analysis. This is non-repainting and non-lagging Harmonic Pattern, Elliott Wave Pattern and X3 Chart pattern. On top of that, this tool can detect around 52 Japanese candlestick patterns. This is the most advanced Chart Pattern detector in the market. You must try. https://algotrading-investment.com/portfolio-item/profitable-pattern-scanner/
● Order Risk Management EA:: This is small utility to calculate your lot size based on your risk. This tool is simple, powerful, and free. https://algotrading-investment.com/portfolio-item/order-risk-management-ea/
● Order Risk Panel Pro:: This is more advanced version of Order Risk Management EA. With this tool, you can send buy and sell orders from price level visually identified in your chart. Of course, you can strictly manage your risk within your risk parameter. https://algotrading-investment.com/portfolio-item/order-risk-panel-pro/
● Pair Trading Station:: Pair Trading Strategy is a unique strategy trading two currency pairs at the same time matching long position of the one currency pair against the short position of another currency pair. Pair Trading Station automatically calculates such opportunity for multiple symbols selected in your MetaTrader symbol list. This is most advanced Pair Trading system in the world of forex market. https://algotrading-investment.com/portfolio-item/pair-trading-station/
● Peak Trough Analysis:: This is a free technical tool designed to work with Price Patterns. This tool is useful to detect triangle, falling wedge and rising wedges. You can also apply this tool to detect Fibonacci Price Patterns. This is free tool and used by over 10,000 traders. https://algotrading-investment.com/portfolio-item/peak-trough-analysis-tool/
● Precision Support Resistance:: This support resistance indicator can detect accurate support and resistance for your price action trading. This is a great tool if you are looking to draw automatic support and resistance in your chart. https://algotrading-investment.com/portfolio-item/precision-support-resistance/
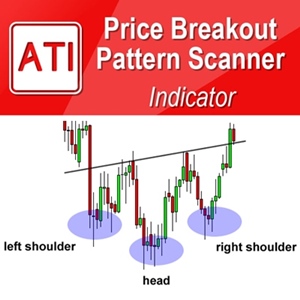
● Price Breakout Pattern Scanner: This is the first automated Chart Pattern Detector in the market. It was designed to detect triangle, falling wedge, rising wedge, double top and head and shoulder patterns and many other patterns. You can even use 52 Japanese candlestick patterns and smart Renko together with this tool. https://algotrading-investment.com/portfolio-item/price-breakout-pattern-scanner/
● Sideways Market Statistical Analyser:: It is the first tool in detecting Sideways market using Statistical method. It is based on the trading idea that volatile market is followed by quite market. Great tool to predict breakout zone. You can also use the sideways market zone as supply and demand zone. https://algotrading-investment.com/portfolio-item/sideways-market-statistical-analyzer/
● Smart Renko:: Smart Renko is the most advanced Renko charting tool in the market. It is a kind of hybrid between candlestick chart and Renko chart. Since it draws Renko brick on candlestick chart, you can take the best of both candle chart and Renko chart. https://algotrading-investment.com/portfolio-item/smart-renko/
● Time Box Indicator:: Time Box Indicator is a time indicator for the trader working in Forex and Stock market. This is a free tool to show the daily and weekly price box in hourly timeframe. https://algotrading-investment.com/portfolio-item/time-box-indicator/
● Turning Point Detector: This is the tool for detecting turning point with prewritten mathematical algorithm. This tool also provides the Market profile as bonus. Great tool but easy to use. https://algotrading-investment.com/portfolio-item/turning-point-detector/
● Volume Spread Pattern Detector:: Volume Spread Analysis seeks to identify the imbalances of Supply and Demand using candle pattern and volume to predict the future direction of prices. This indicator detects volume spread patterns for potential buy and sell opportunity. If you are trader using volume spread analysis, you must use this tool. It is free. https://algotrading-investment.com/portfolio-item/volume-spread-pattern-detector/
● Volume Spread Pattern Indicator:: Wyckoff Method is a technical analysis to identify the market cycle with supply and demand force, which is also known as accumulation and distribution area. Volume spread indicators identifies demand and supply patterns. These patterns are best used to detect the demand zone (=accumulation area) and supply zone (=distribution area). This is a great tool for volume spread analysis. https://algotrading-investment.com/portfolio-item/volume-spread-pattern-indicator/
● Volume Zone Oscillator:: Volume Zone Oscillator is one of the very few technical indicator relating volume and price together to identify potential buying and sell opportunity. Like RSI or CCI, the Volume Zone Oscillator is a great tool to identify overbought and oversold timing for your trading. This tool is free. https://algotrading-investment.com/portfolio-item/volume-zone-oscillator/
To overview all the product list, you can also visit the following two links:
https://www.mql5.com/en/users/financeengineer/seller#products
https://algotrading-investment.com/our-products-list/
Related Products


